Q1 2026: 19 Data-Driven Insights on AI Cost, Output, and the Widening Talent Gap
We scanned 500,000+ PRs across 10,000+ engineers and 500+ organizations (sizes 1 to 4,000+). Engineers are producing dramatically more with AI, costs are tripling, and the gap between teams that measure this and teams that don't is becoming permanent.
19 insights across five sections below. Every chart comes directly from data in our platform.
Section 1: AI Effectiveness
AI went from experiment to infrastructure in six months. Here is who is winning and why.
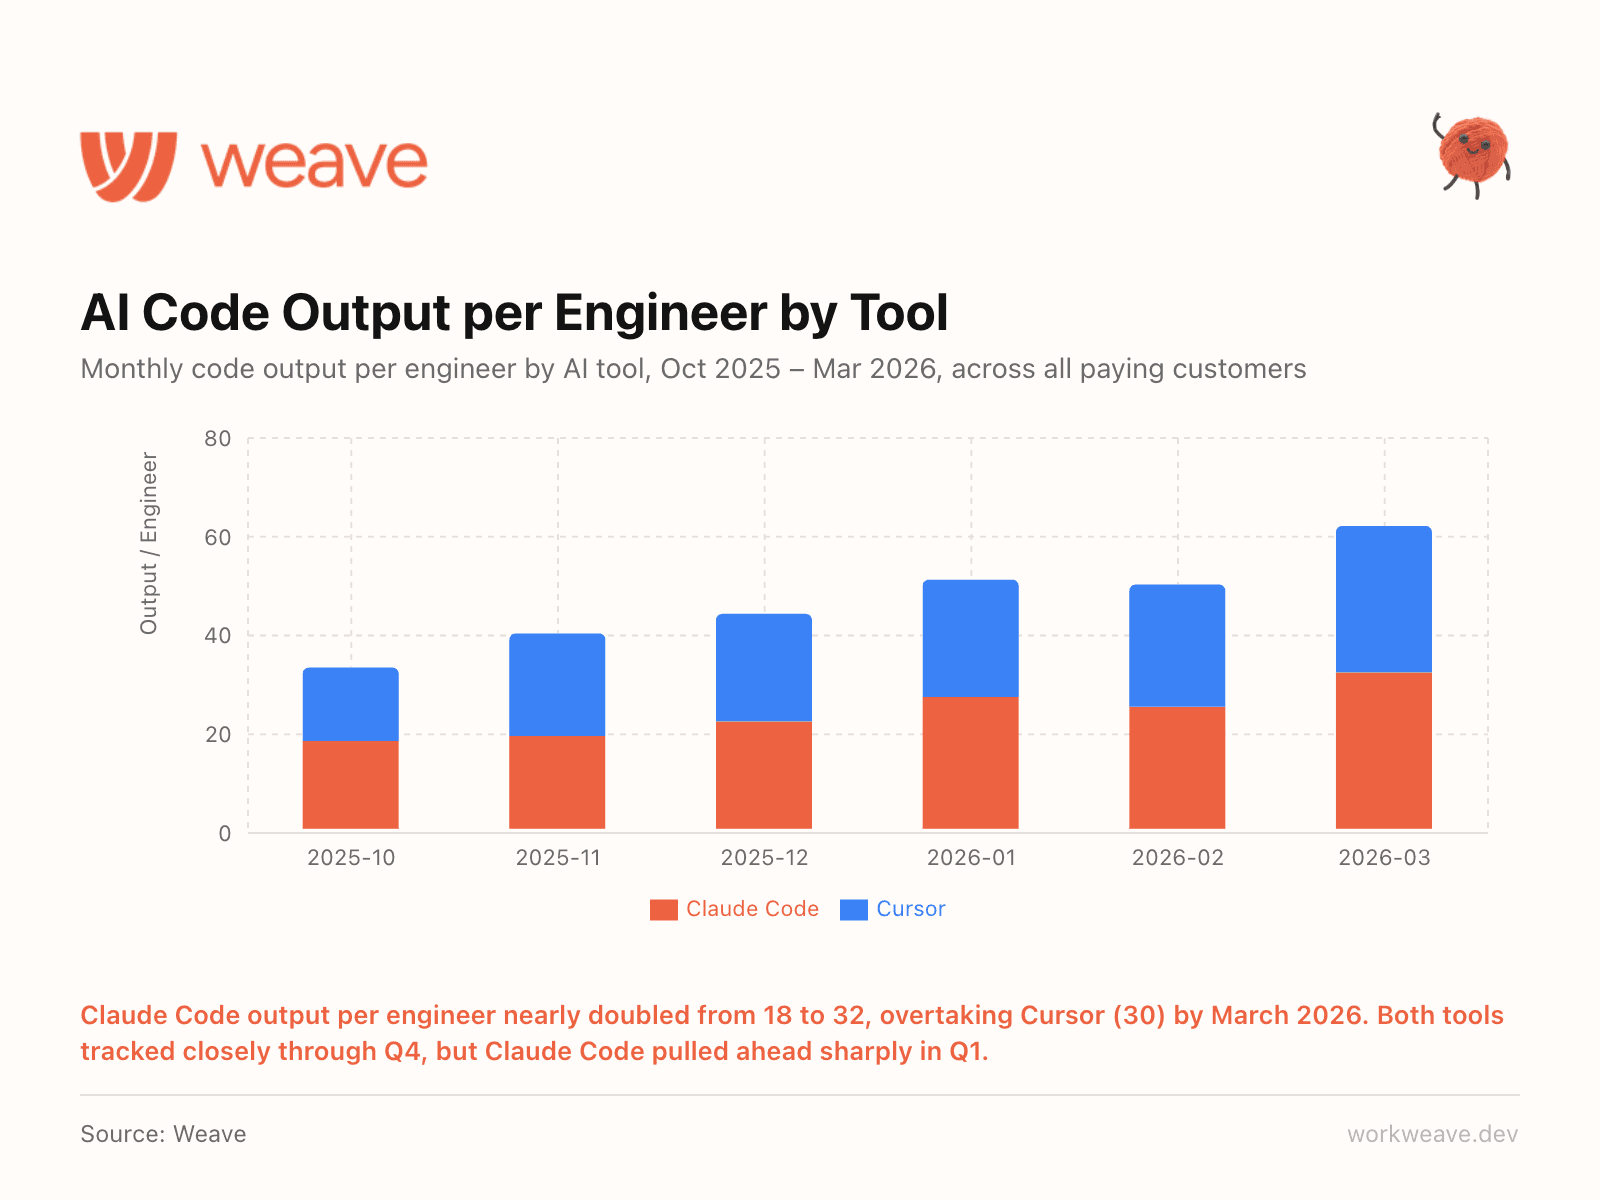
1. Claude Code pulled ahead
Claude Code output per engineer nearly doubled from 18 to 32 units/month between October 2025 and March 2026. Through Q4, Claude Code and Cursor tracked almost identically. Then in January, Claude Code broke away and by March it was outproducing Cursor (30) by a meaningful margin.
We track Claude Code and Cursor data directly via their APIs, as well as through Claude telemetry and Git metadata tracking. The gap has widened every month since January, and with continued investment from Anthropic, we expect it to accelerate.
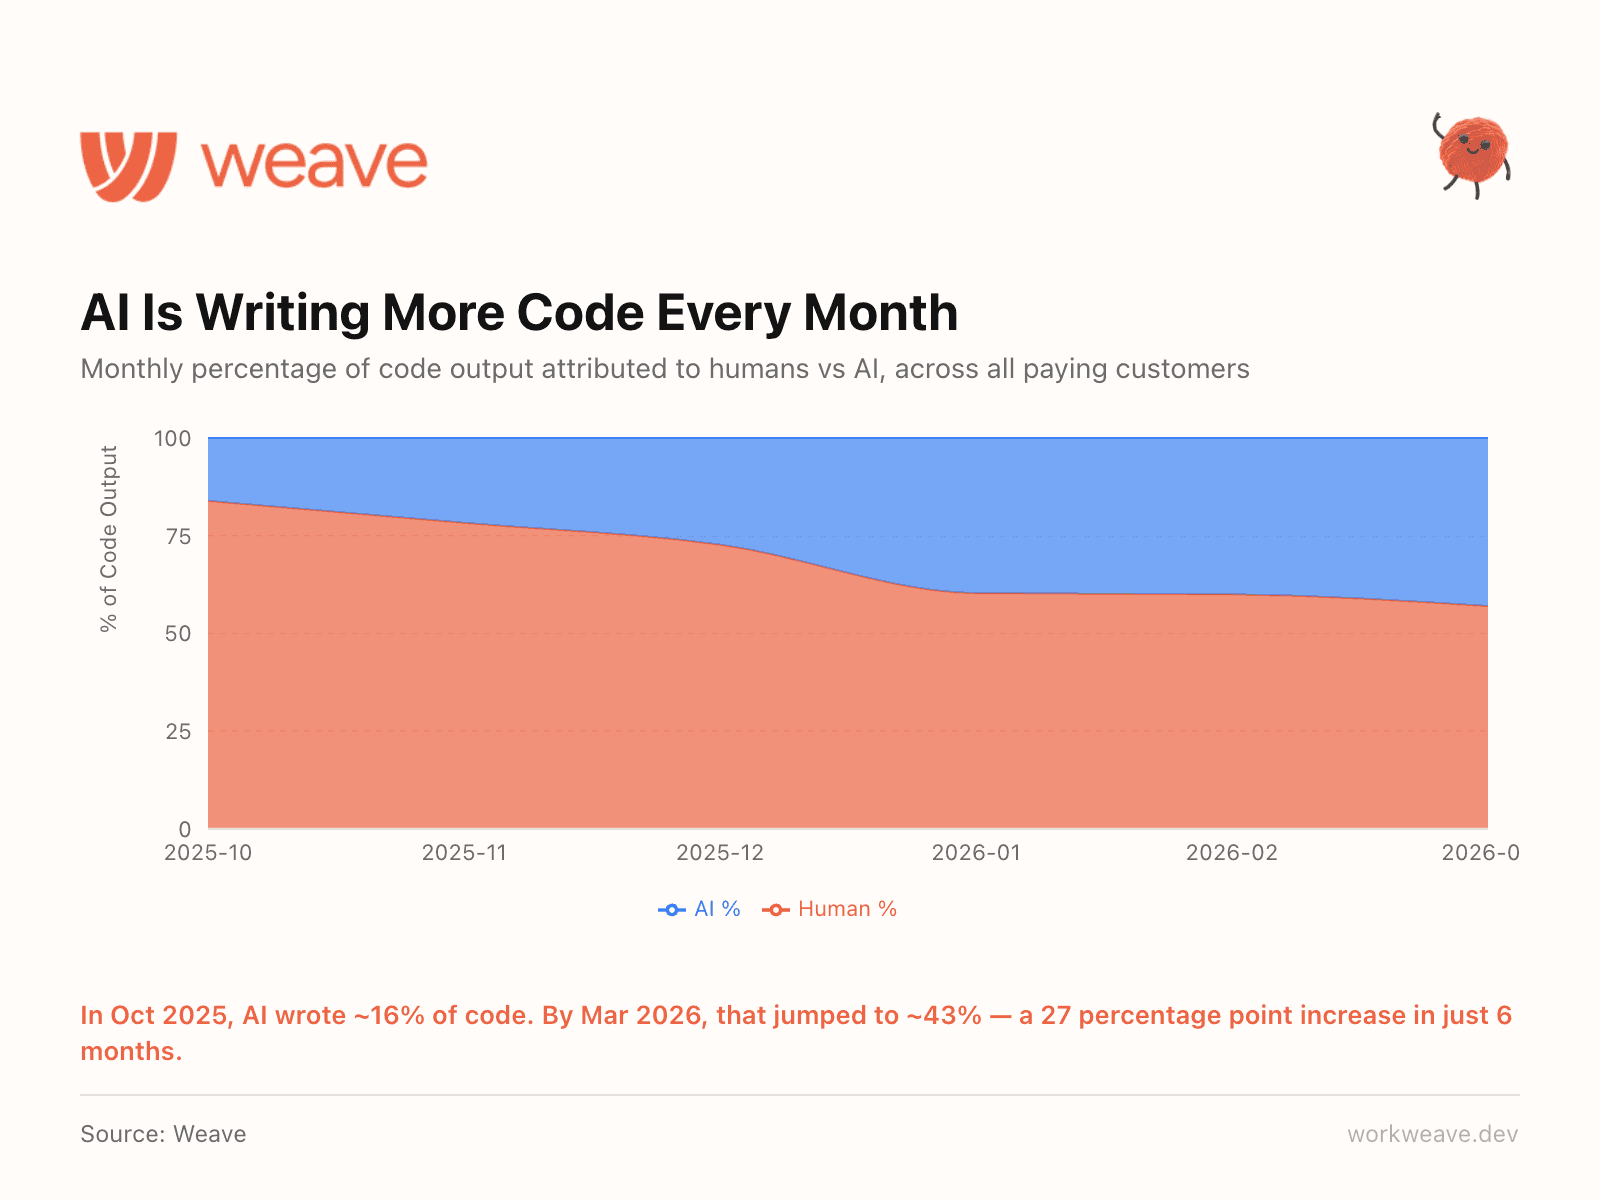
2. AI now writes 43% of all code
In October 2025, AI accounted for roughly 16% of code output. Six months later, that number is 43%. The shift accelerated sharply in Q1 2026 as teams moved from experimenting with AI tools to embedding them into daily workflows.
Nearly half of all code being shipped right now was written or substantially generated by AI. Many teams (including ours) are at 100% AI written code. This changes how you think about code quality, ownership, review processes, and what "engineering productivity" even means.
The question is no longer "should we adopt AI tools?" It is "how far can we push the AI tools we use?"
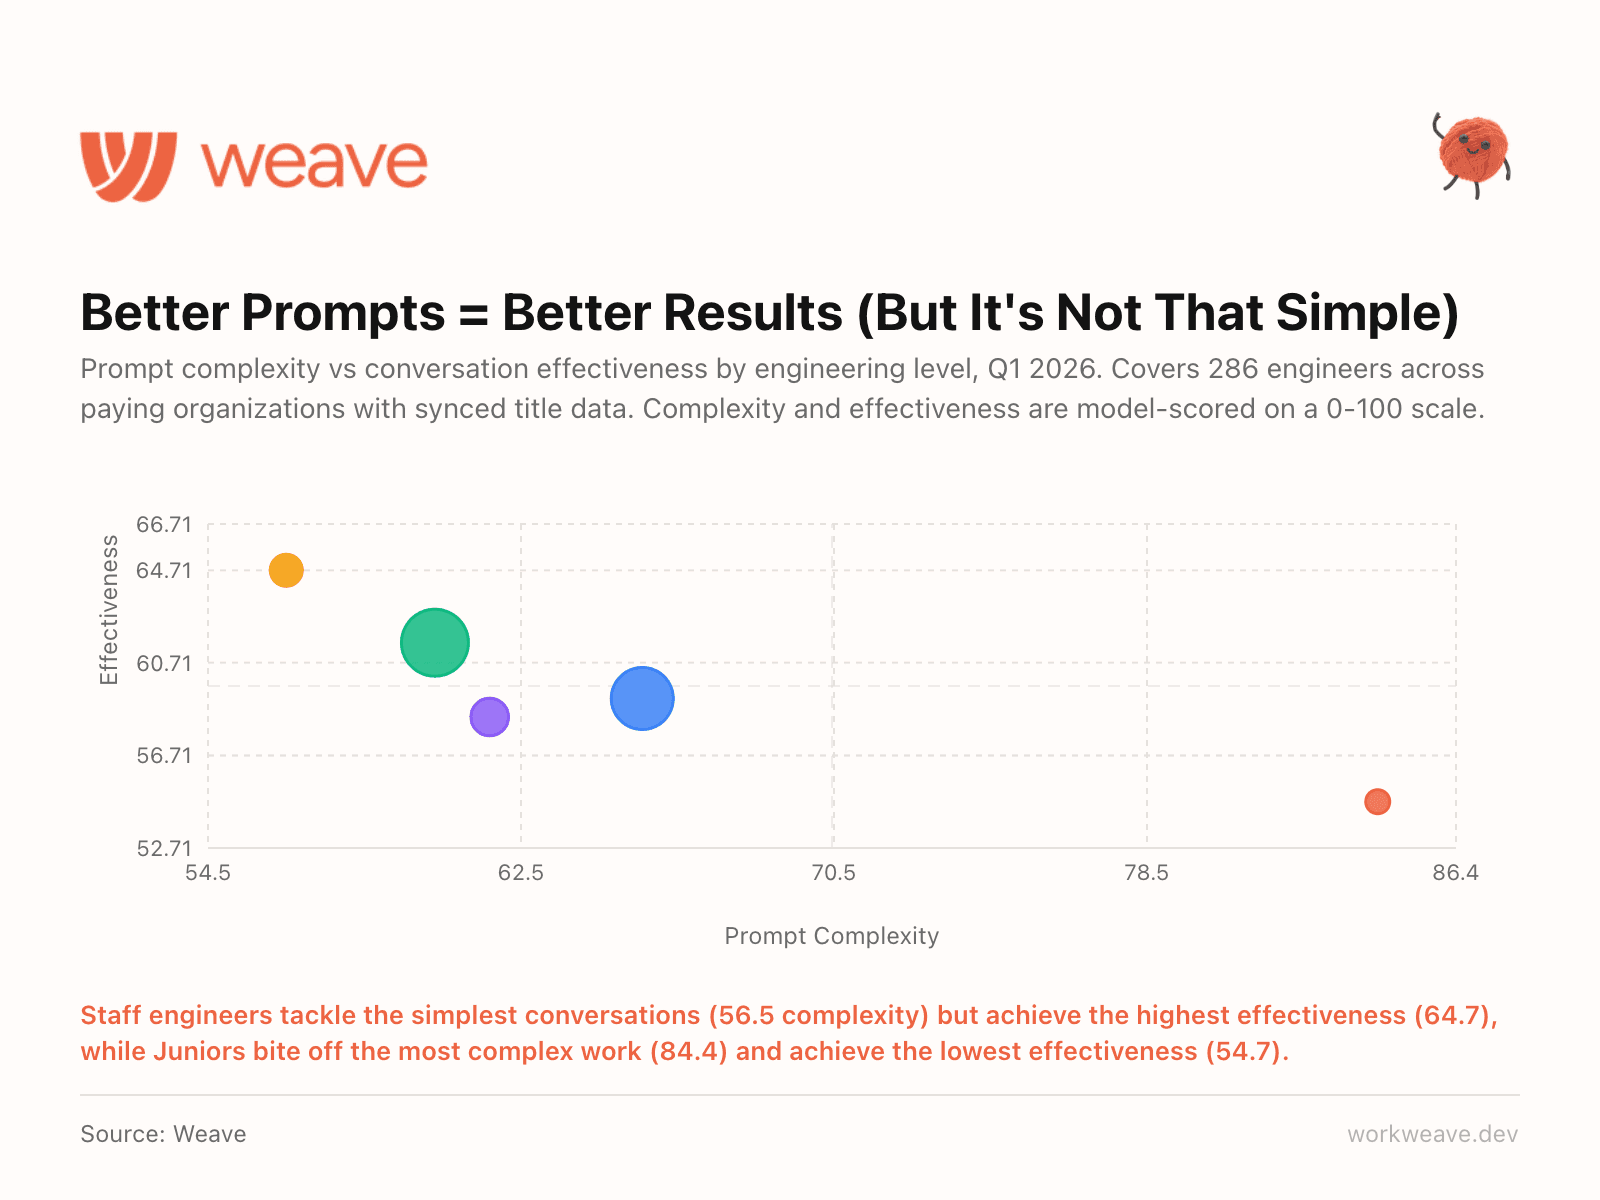
3. Staff engineers write the simplest prompts and get the best results
You would assume junior engineers, having grown up with AI tools, would be the most effective prompters. Our data says the opposite.
Staff engineers scored 64.7 on conversation effectiveness with an average prompt complexity of just 56.5. Juniors scored 54.7 effectiveness while tackling prompts rated 84.4 in complexity. The pattern is consistent across every seniority level: the more senior the engineer, the simpler their prompts and the better their results.
Our guess is that senior engineers know what to ask for. They break problems into smaller, well-scoped requests. Juniors try to solve everything in one complex prompt. This has real implications for training. Teaching juniors to write more focused prompts will likely improve their AI effectiveness more than any prompt engineering course.
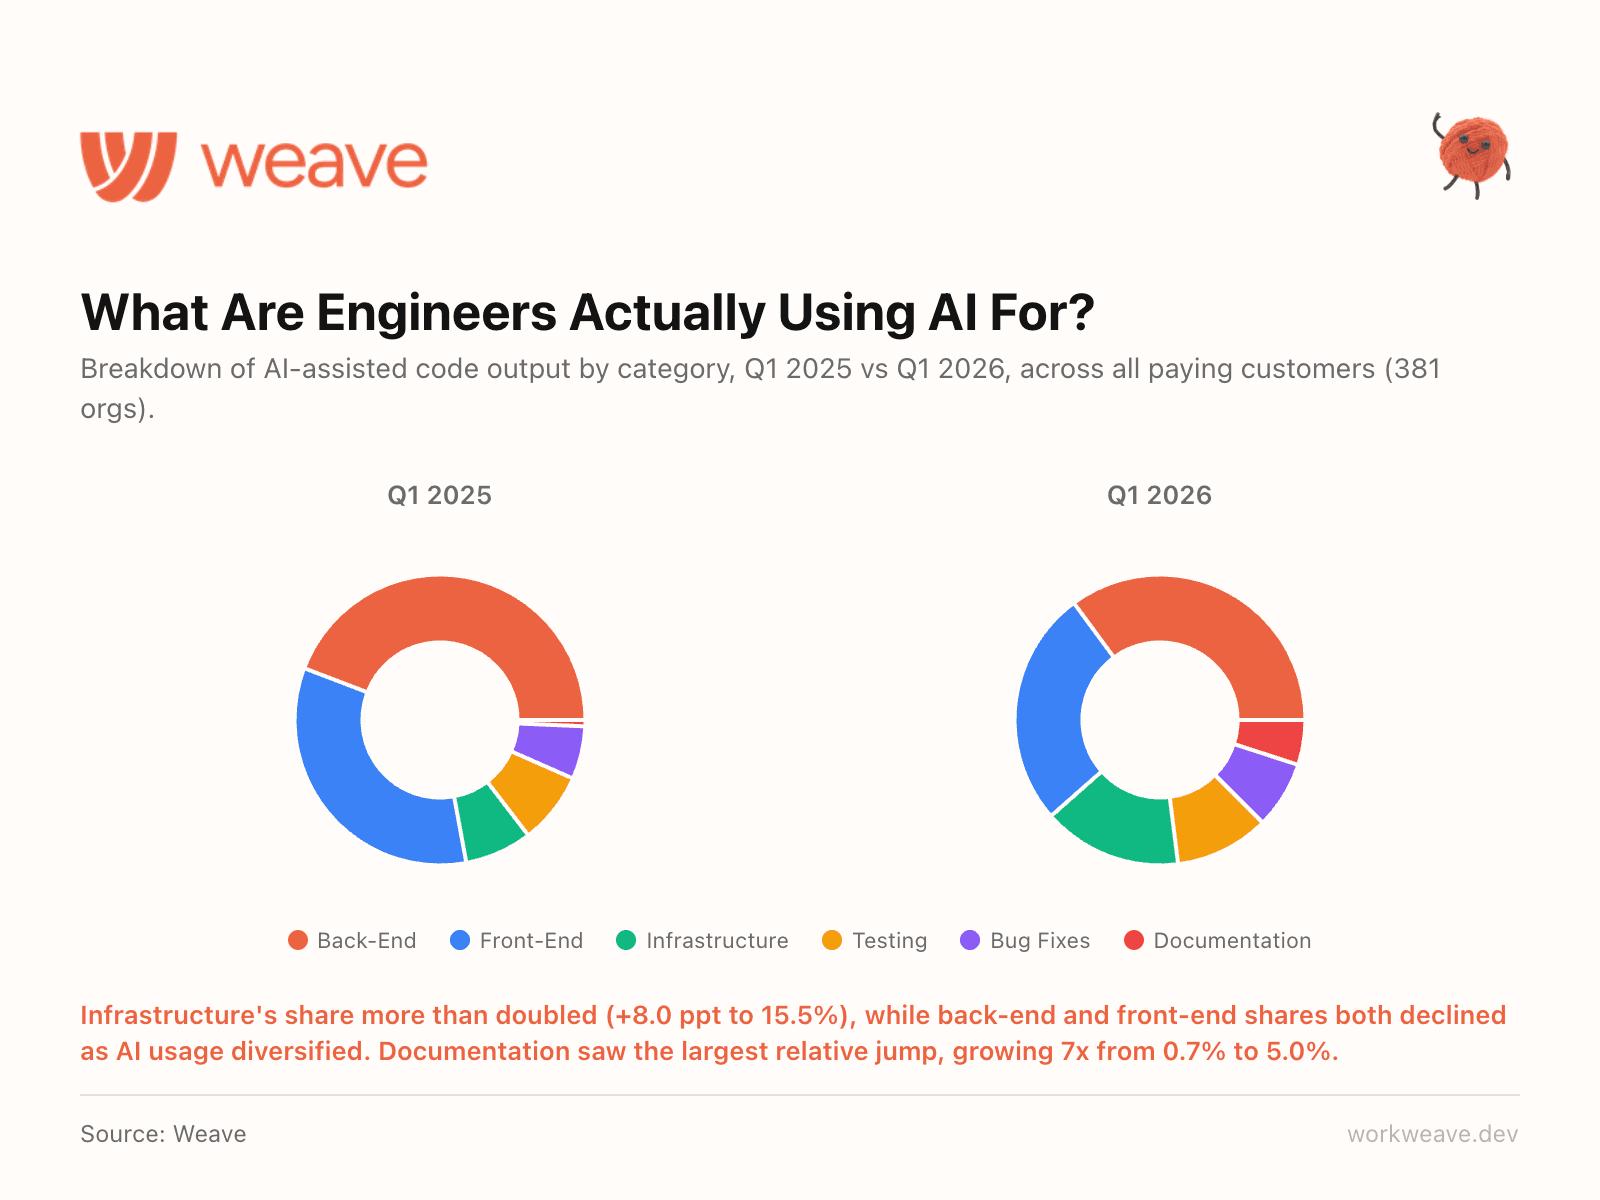
4. AI usage is diversifying fast (and infrastructure is the surprise winner)
A year ago, AI-assisted coding was mostly about front-end and back-end feature work. That has changed completely.
Infrastructure's share of AI-assisted output more than doubled, jumping 8 percentage points to 15.5% of all AI code. Documentation saw the largest relative jump, growing 7x from 0.7% to 5.0%. Meanwhile, backend and frontend shares both declined, not because teams are using AI less for features, but because AI usage is spreading into all categories.
Teams are using it for the unglamorous but high-value work: infrastructure, devops, testing, and documentation. The teams getting the most out of AI are the ones deploying it across the entire engineering workflow, not just the parts that ship user-facing features.
5. Debugging dominates the conversation
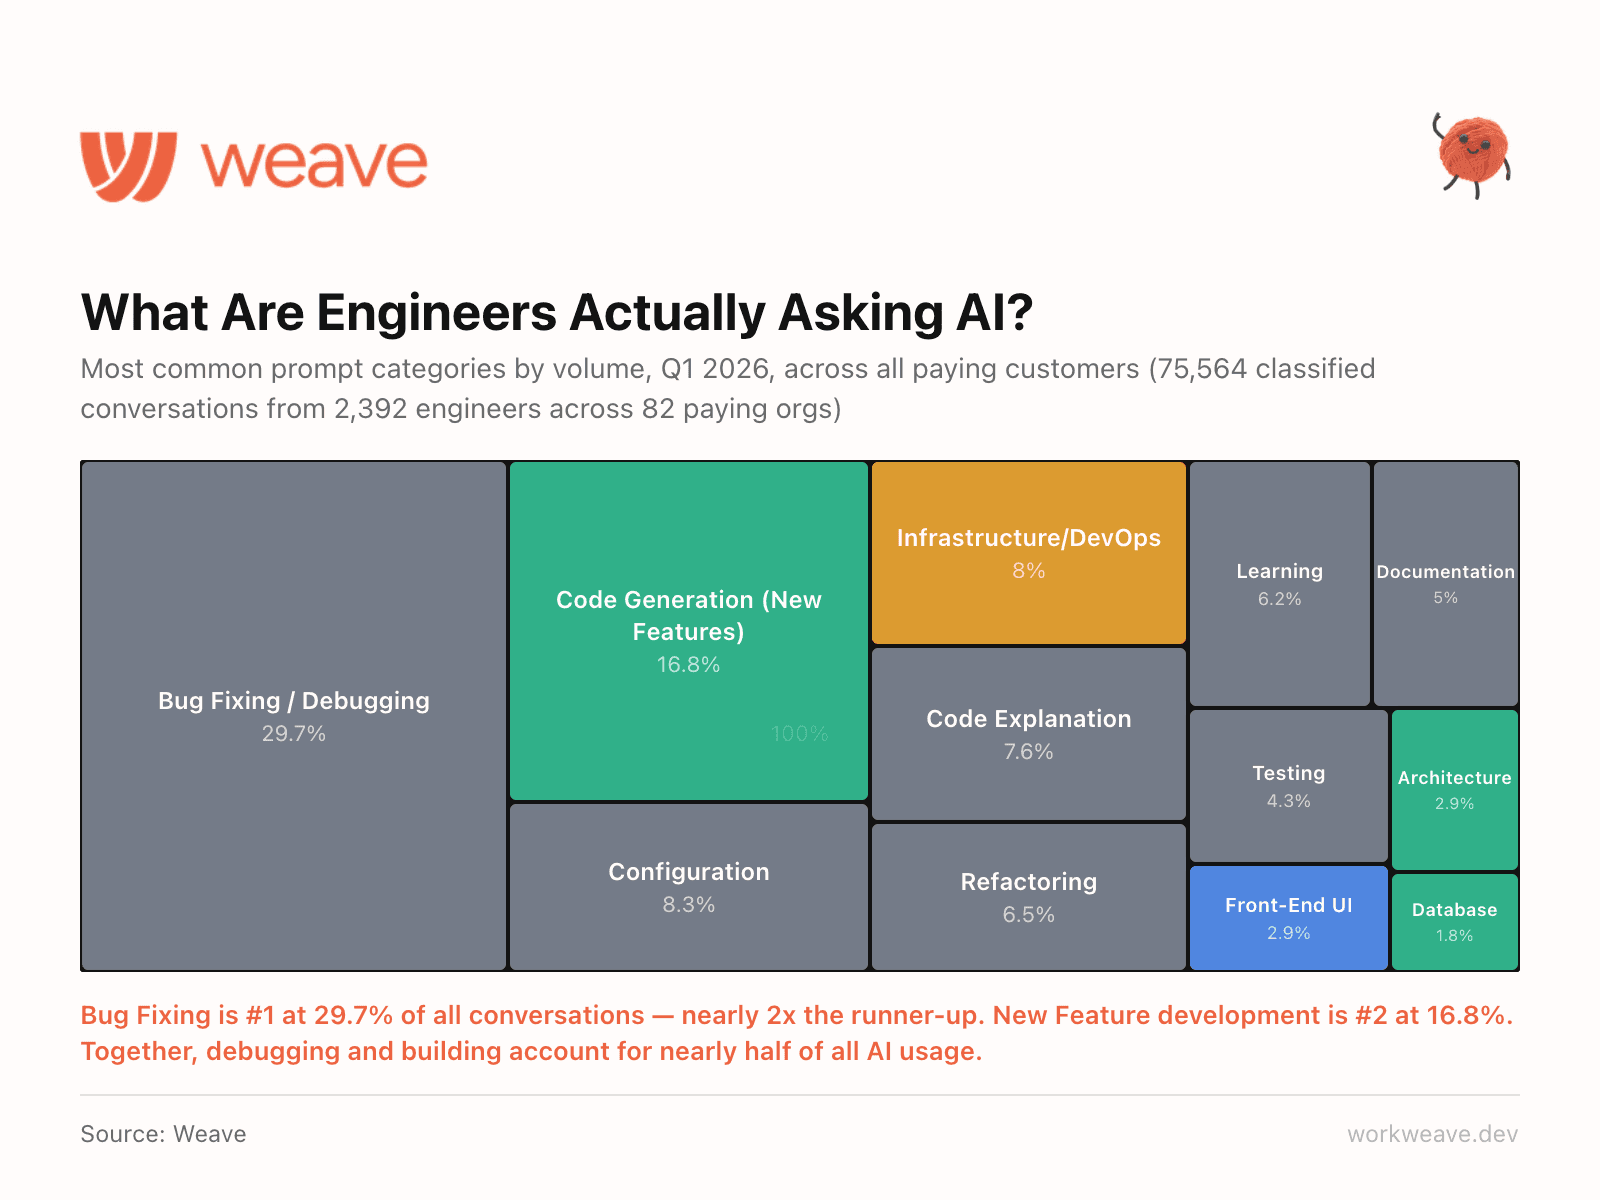
We categorized every AI conversation across our dataset. Bug Fixing is the #1 use case at 29.7% of all conversations, nearly 2x the runner-up. New Feature development is #2 at 16.8%.
Together, debugging and building account for nearly half of all AI coding tool usage. If your AI adoption strategy is focused on code generation, you are optimizing for the wrong use case. Engineers are using AI to fix things, not just build them.
Section 2: AI Cost
AI tool spend is rising fast. Here is what it costs per user, by team size, and across usage tiers.
6. AI spend per engineer tripled in 6 months
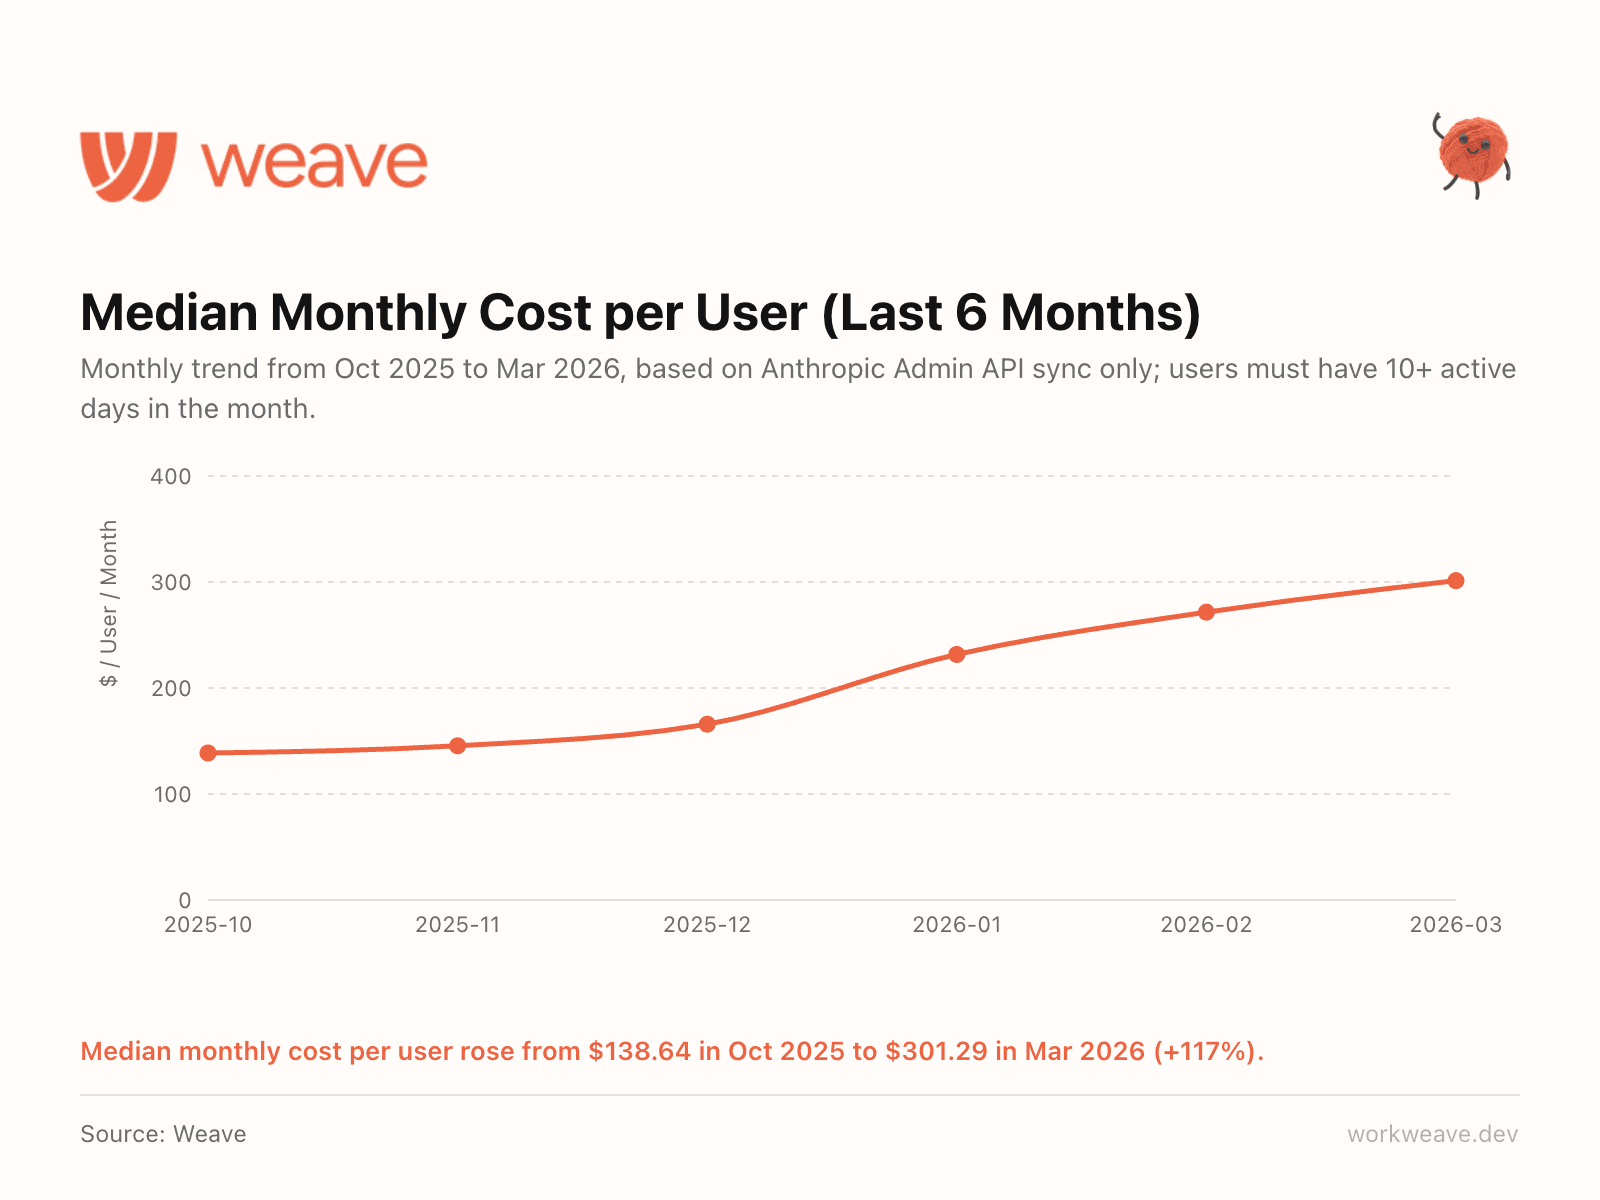
Average cost per user rose from $167.68 in October 2025 to $515.57 in March 2026, a 207% increase. The monthly median rose from $138.64 to $301.29 (+117%).
Output per engineer is up 45% in the same period. So the ROI math works, but only if you are tracking both sides. Most teams track AI spend or output. Almost nobody tracks them together. That gap is where the real insight lives.
Note: this is based on Claude Code spend only (via Anthropic Admin API sync), not aggregate across all tool stack.
7. What does "normal" AI spend look like?
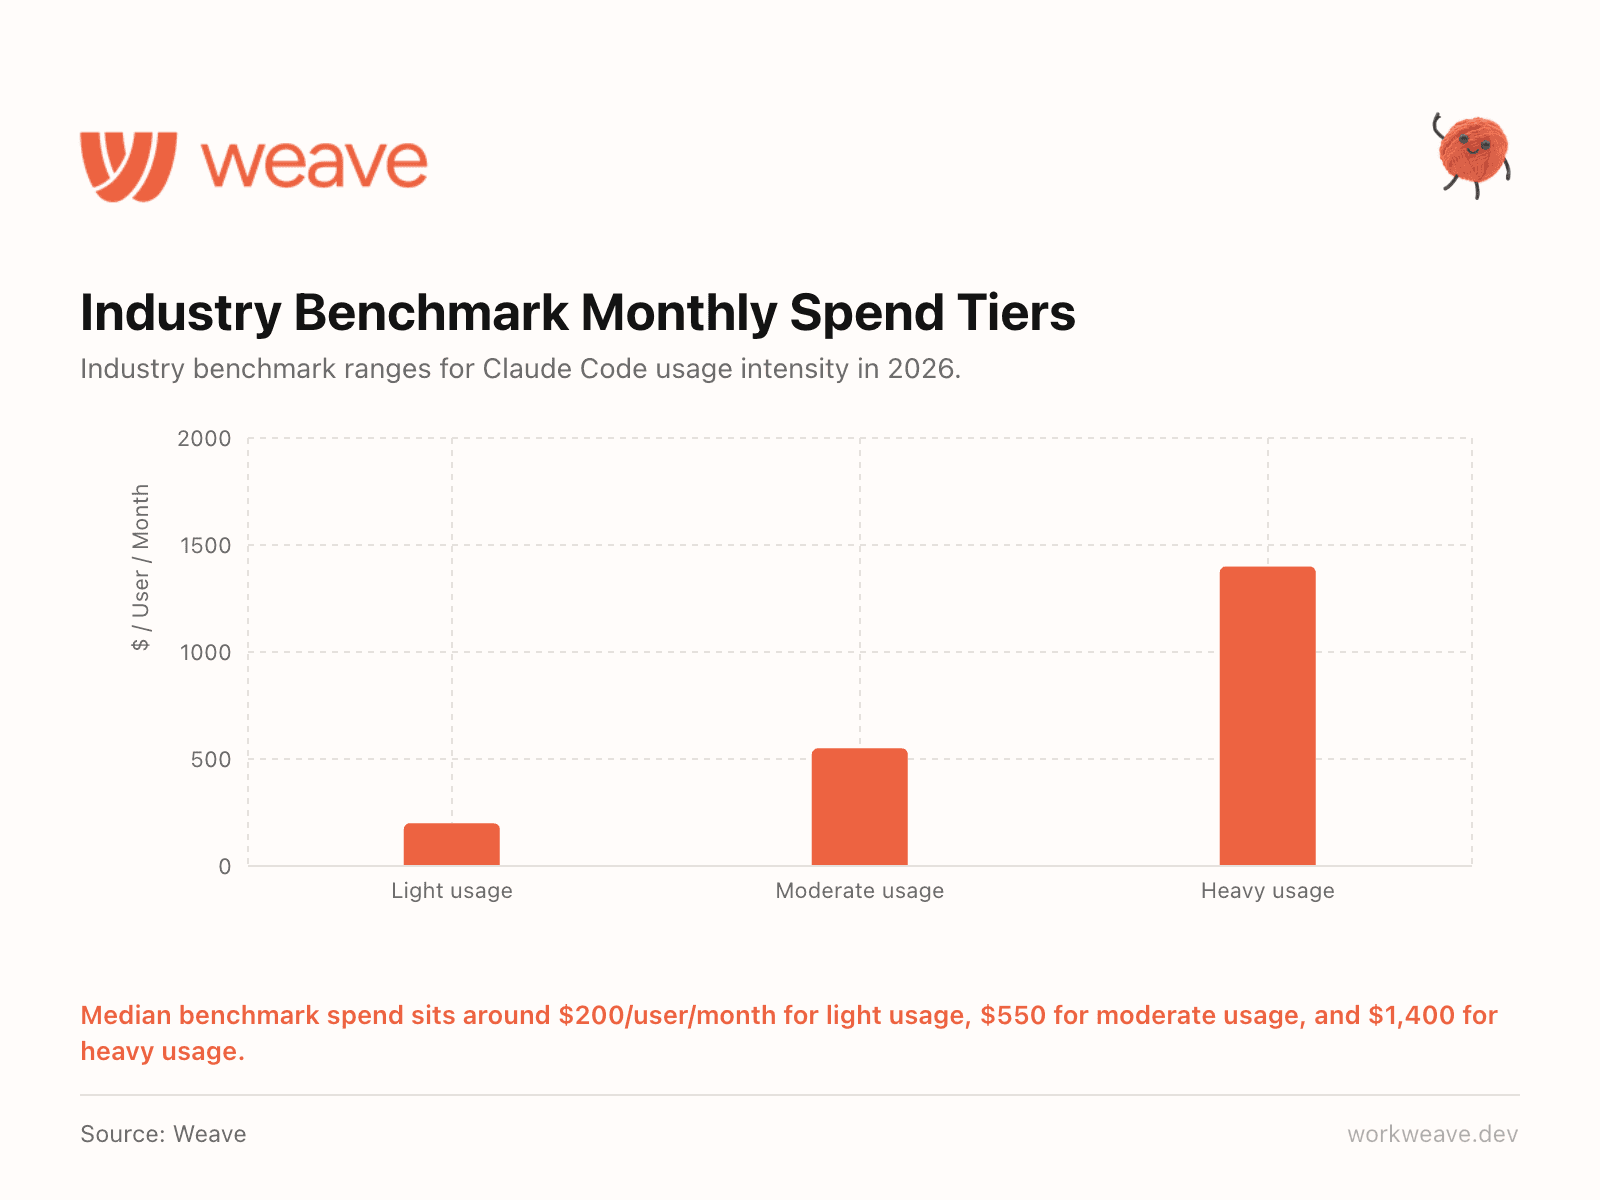
This is the question every engineering leader is asking and nobody has had good benchmarks.
We built industry-level spend tiers based on actual usage data across our customer base. This is the first quarter with this data, but based on Claude Code we are seeing: light users at about $200/user/month, moderate at $550/user/month, and heavy usage at $1,400/user/month.
Most engineering leaders have no benchmark for whether their AI spend is normal. Now they do.
8. Smaller teams spend more per engineer
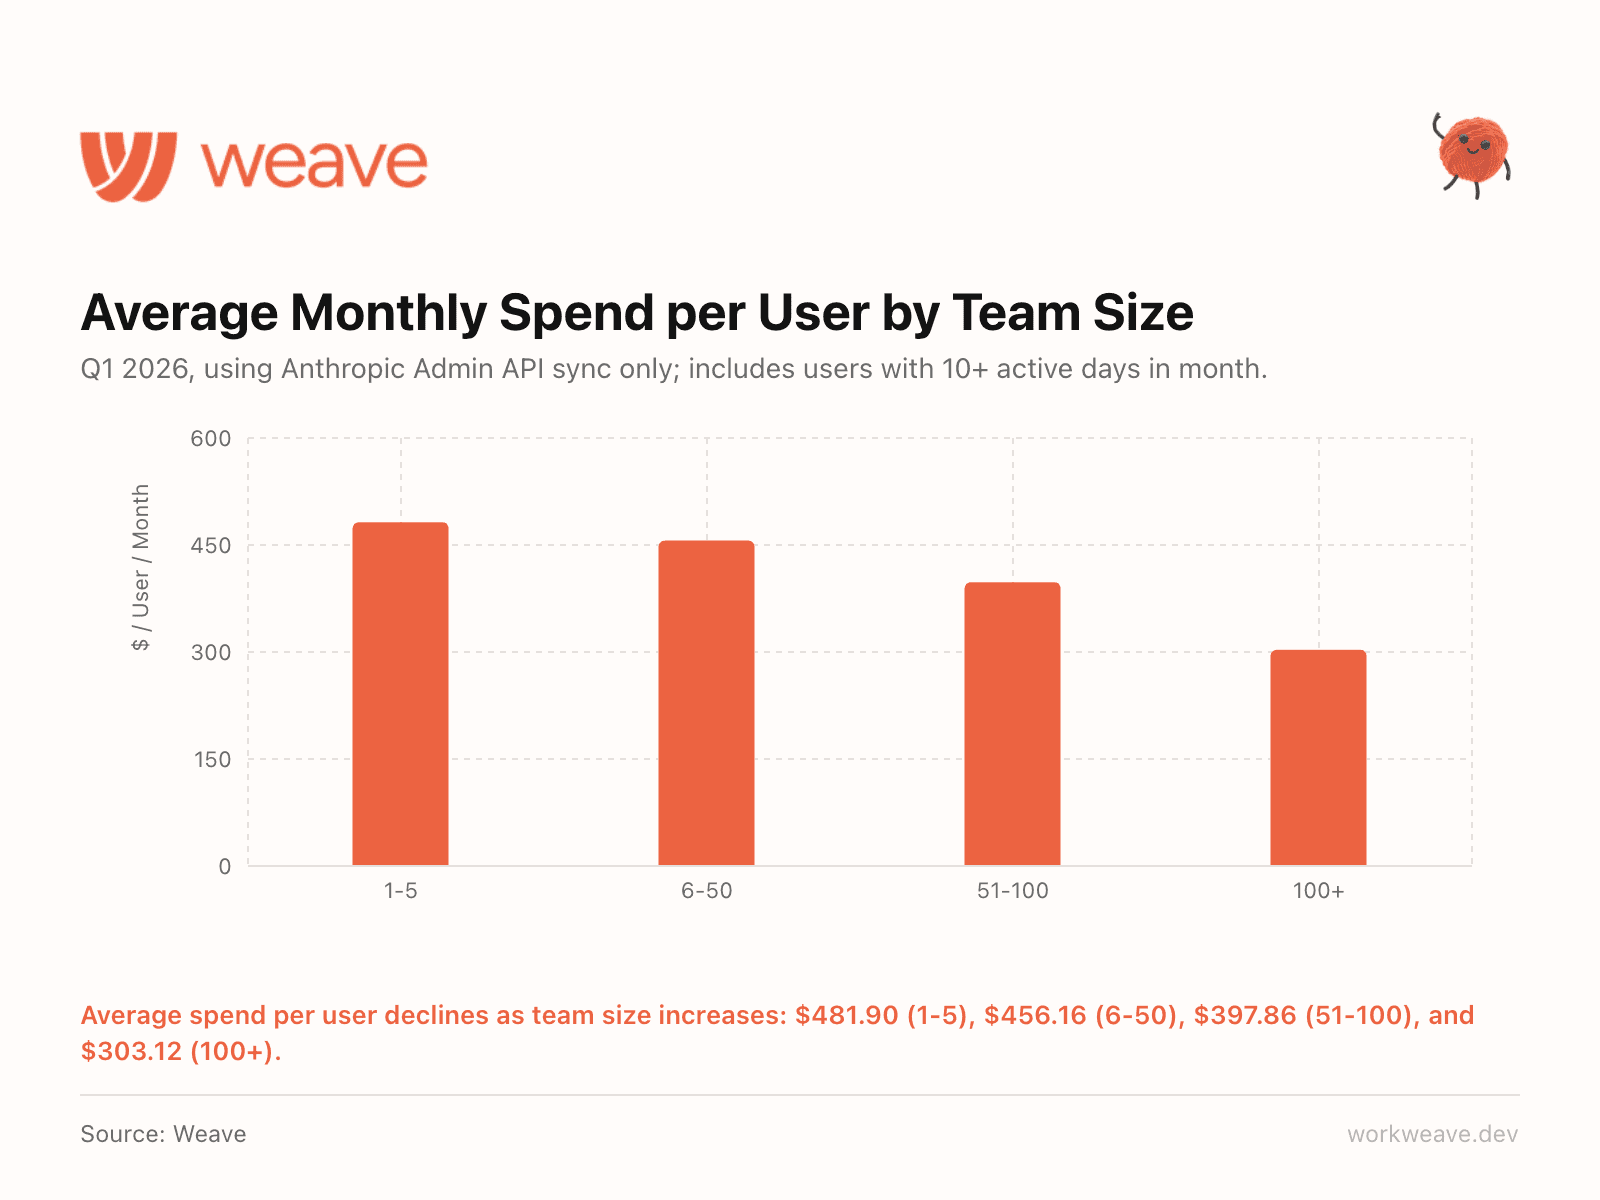
Average monthly AI spend per user declines as team size increases: $481.90 (1-5 engineers), $456.16 (6-50), $397.86 (51-100), and $303.12 (100+).
Smaller teams lean harder on AI and they spend more per head because of it. But here is the important caveat: the vast majority of smaller teams have not yet integrated their AI tools with centralized tracking, meaning actual spend is likely significantly higher than reported here.
Section 3: Output & PR Velocity
Output is up and the data shows exactly where the inflection points are.
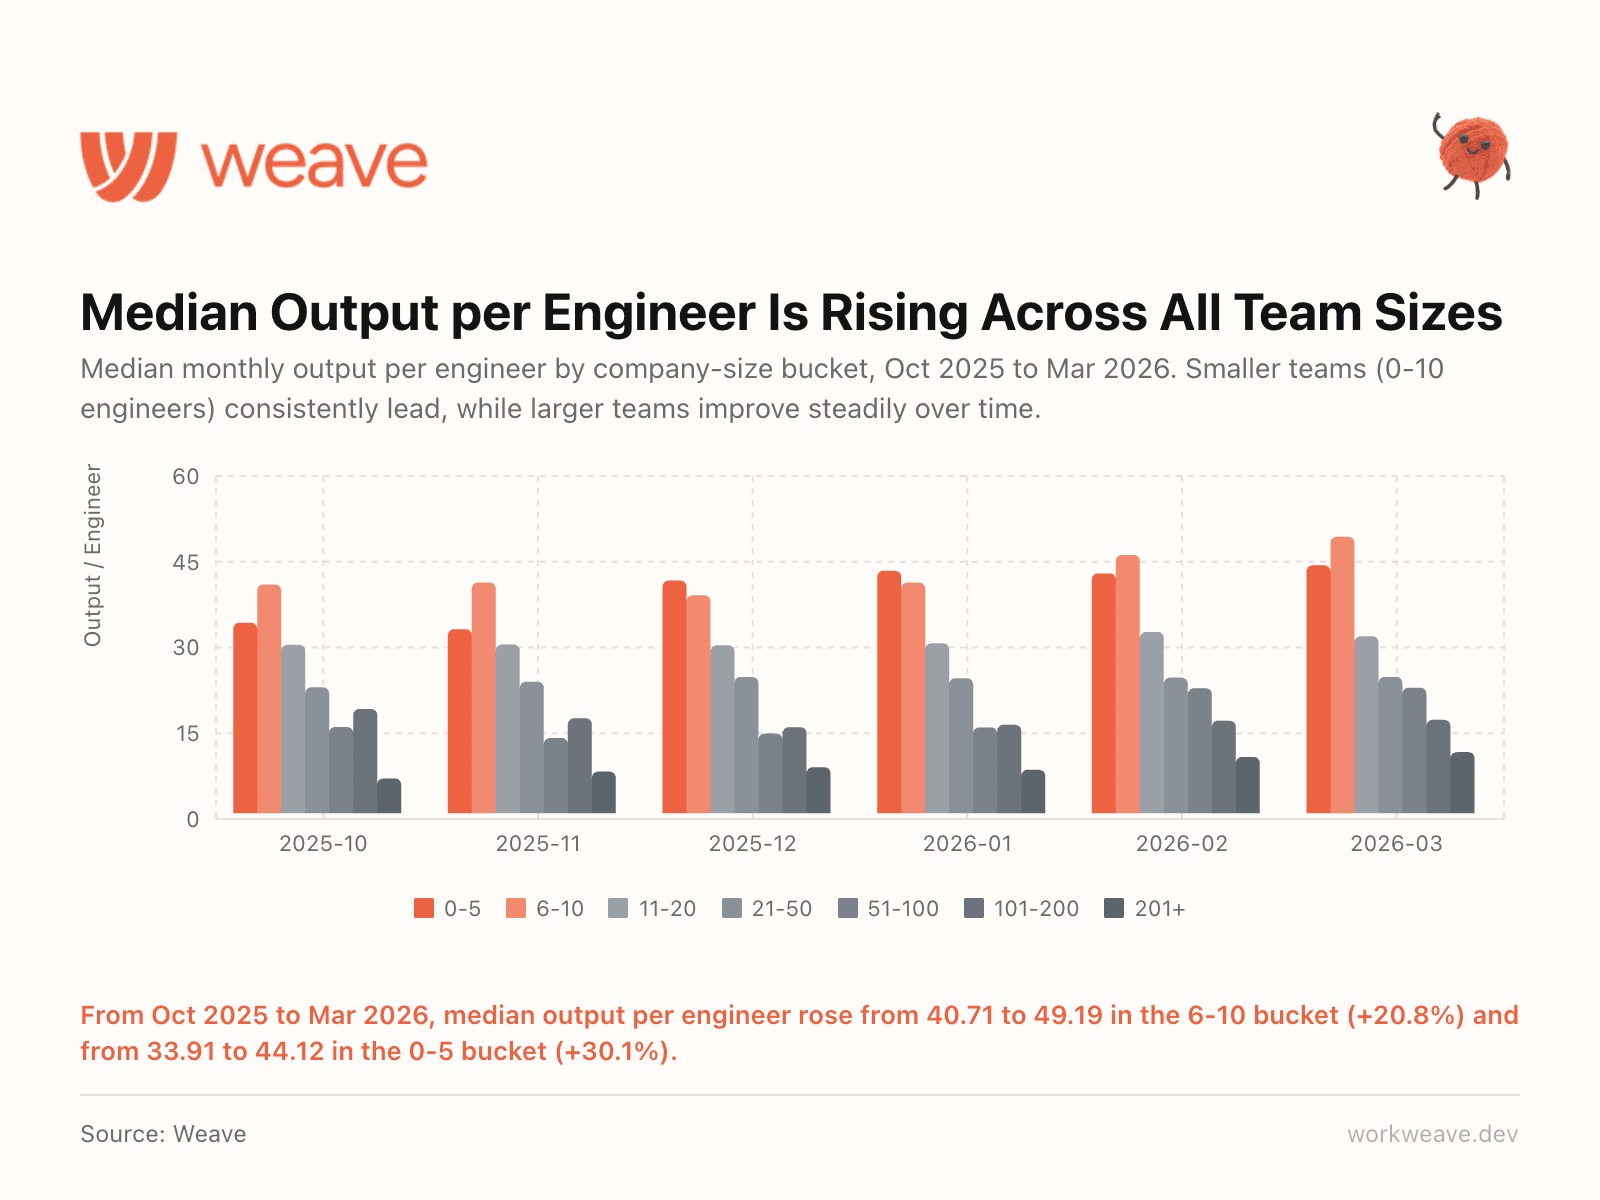
9. Output is rising across all team sizes
Output per engineer is rising across all team sizes. Smaller teams (0-10 engineers) consistently lead, while larger teams improve steadily. The 6-10 bucket rose 20.8% and the 0-5 bucket rose 30.1% over 6 months.
The "AI only helps small teams" narrative does not hold up. Every size bucket is improving. The question is how fast.
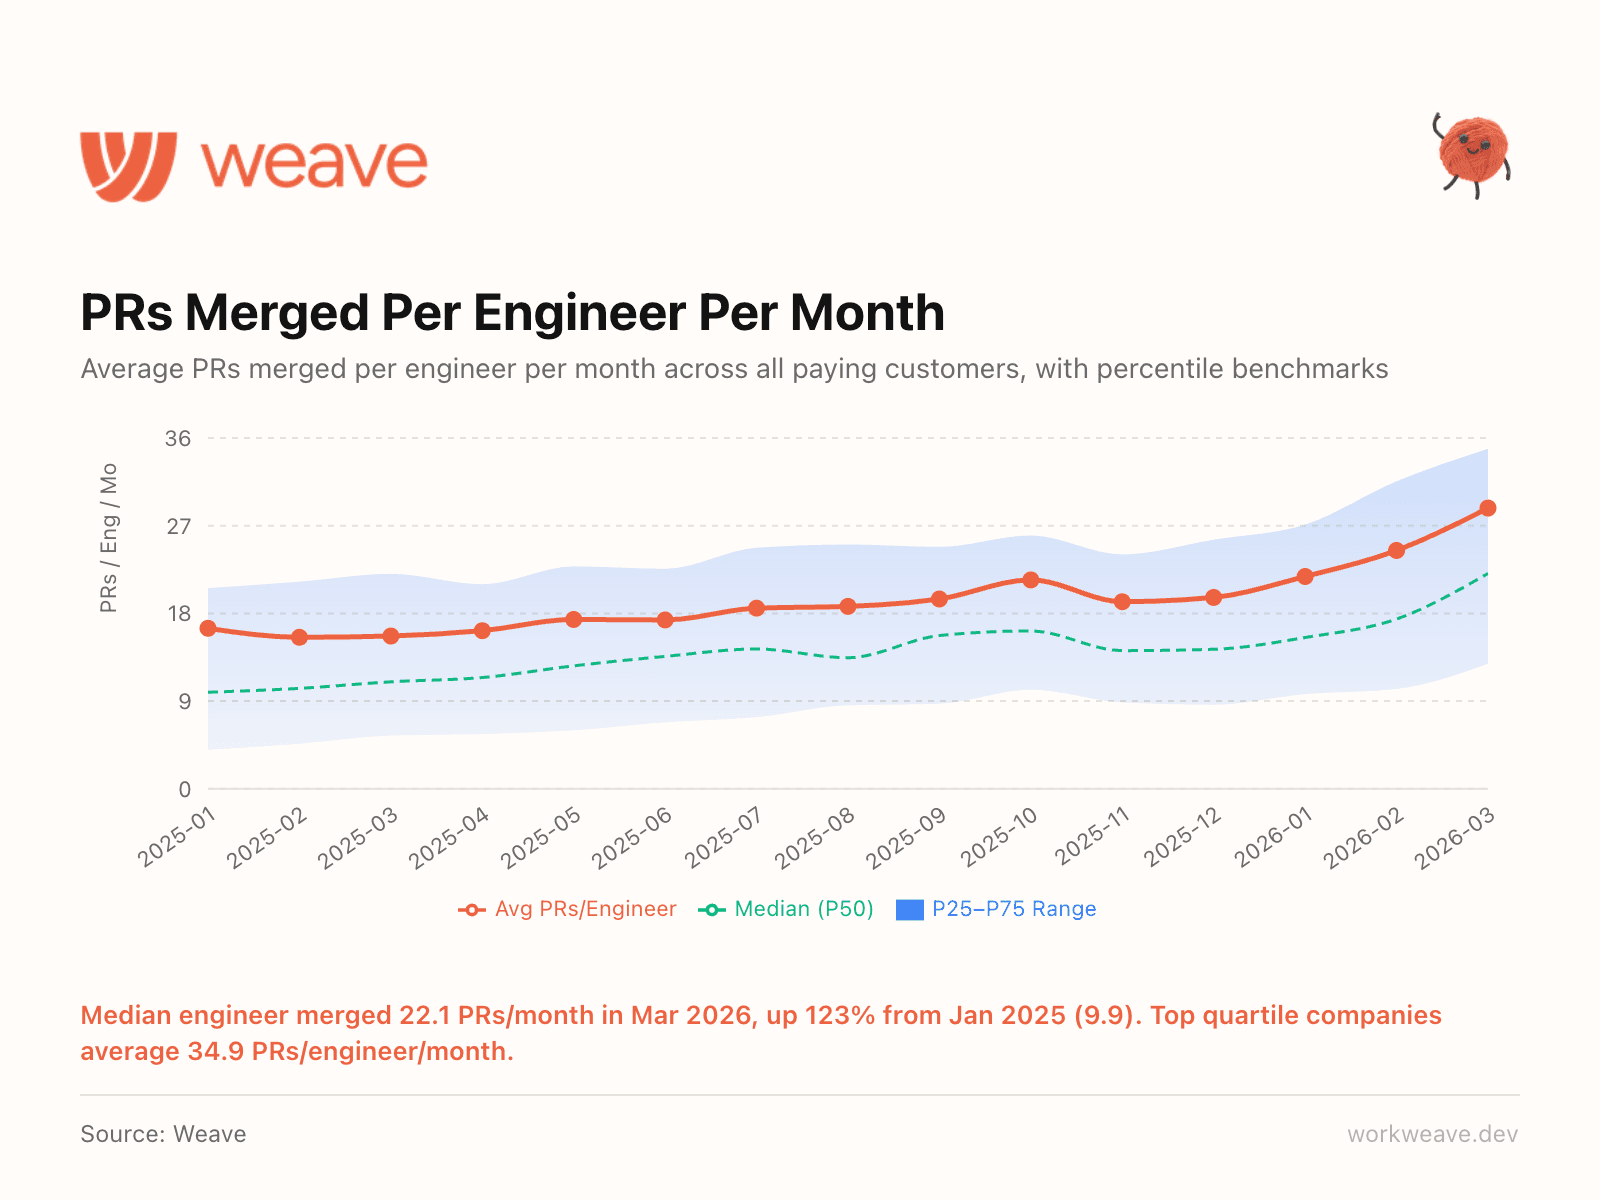
10. Merge velocity is accelerating
The median engineer merged 22.1 PRs/month in March 2026. In January 2025, that number was 9.9. That is a 123% increase in 14 months.
Top quartile companies average 34.9 PRs per engineer per month. If your team is below 22 merged PRs/engineer/month, you are now below the industry median.
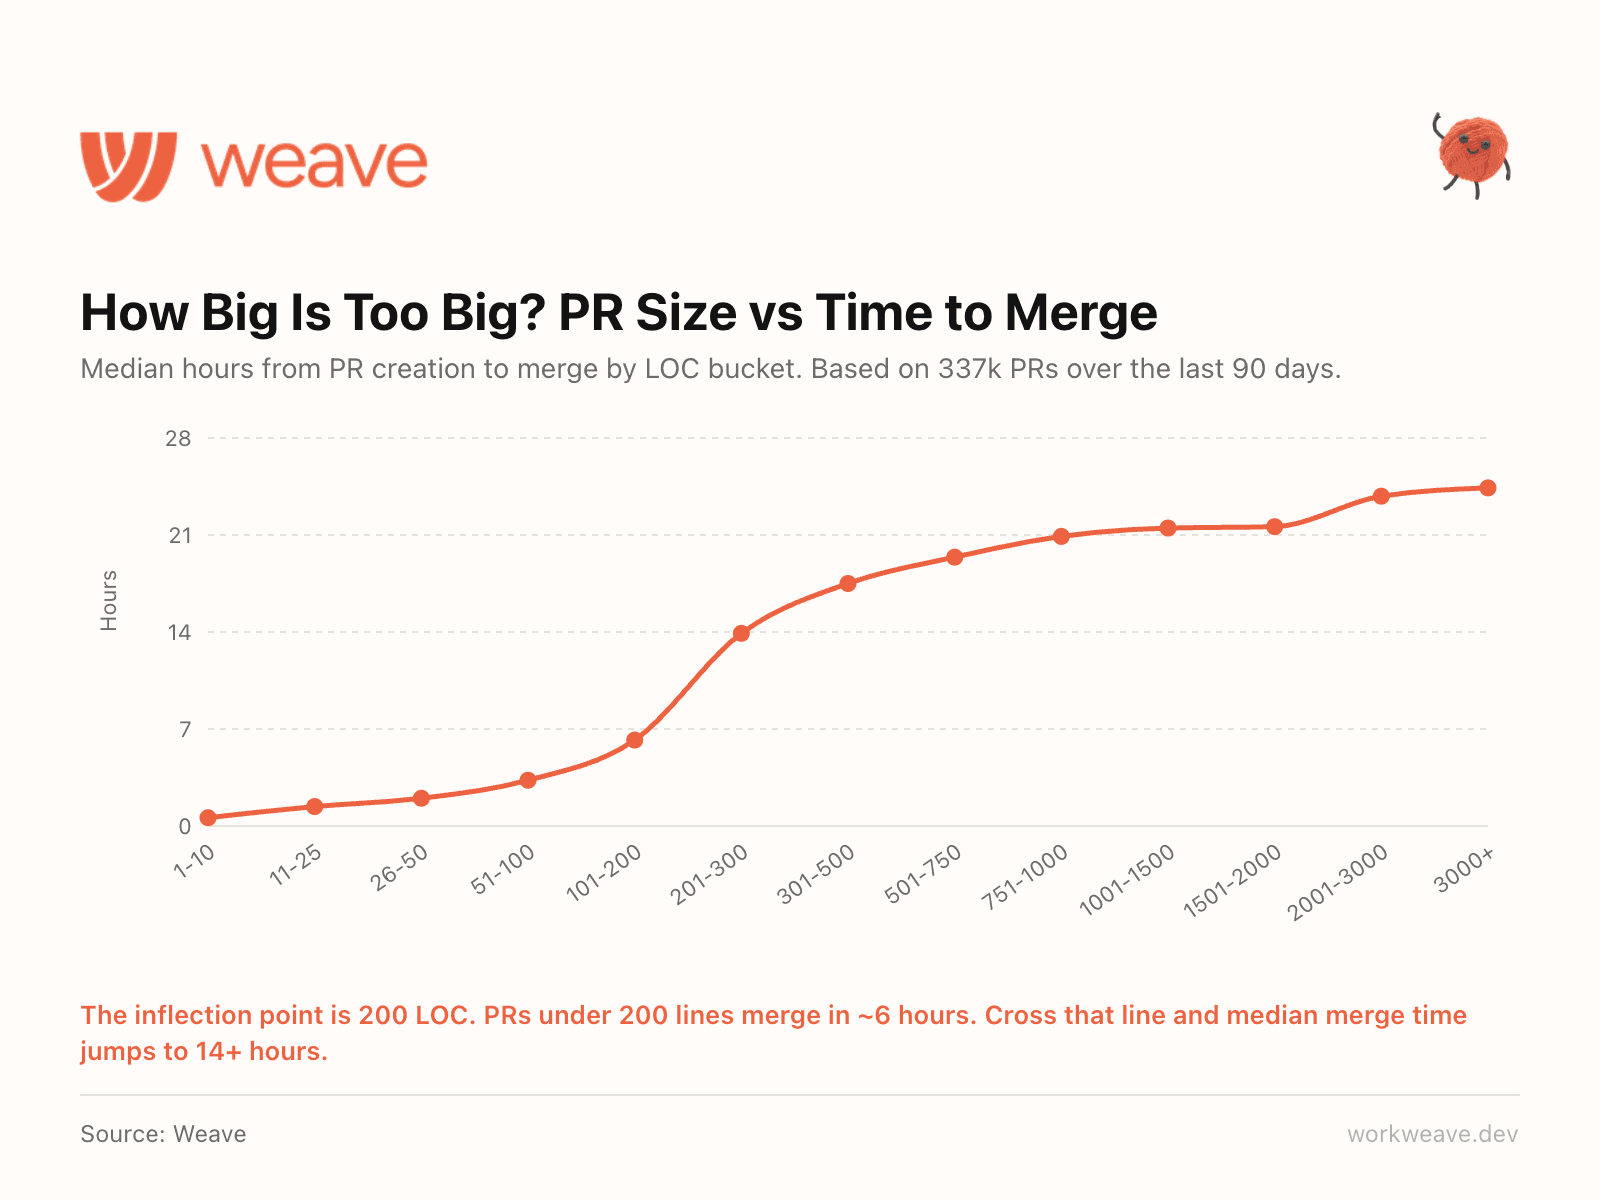
11. There is a clear PR size threshold at 200 LOC
We analyzed hundreds of thousands of PRs to find where merge time breaks down. The inflection point is 200 lines of code.
PRs under 200 lines merge in about 6 hours. Cross that line and median merge time jumps to 14+ hours. Larger PRs create cognitive load that slows everything downstream. If your team has a PR size policy, make 200 LOC the line.
Based on 337,000 PRs over the last 90 days.
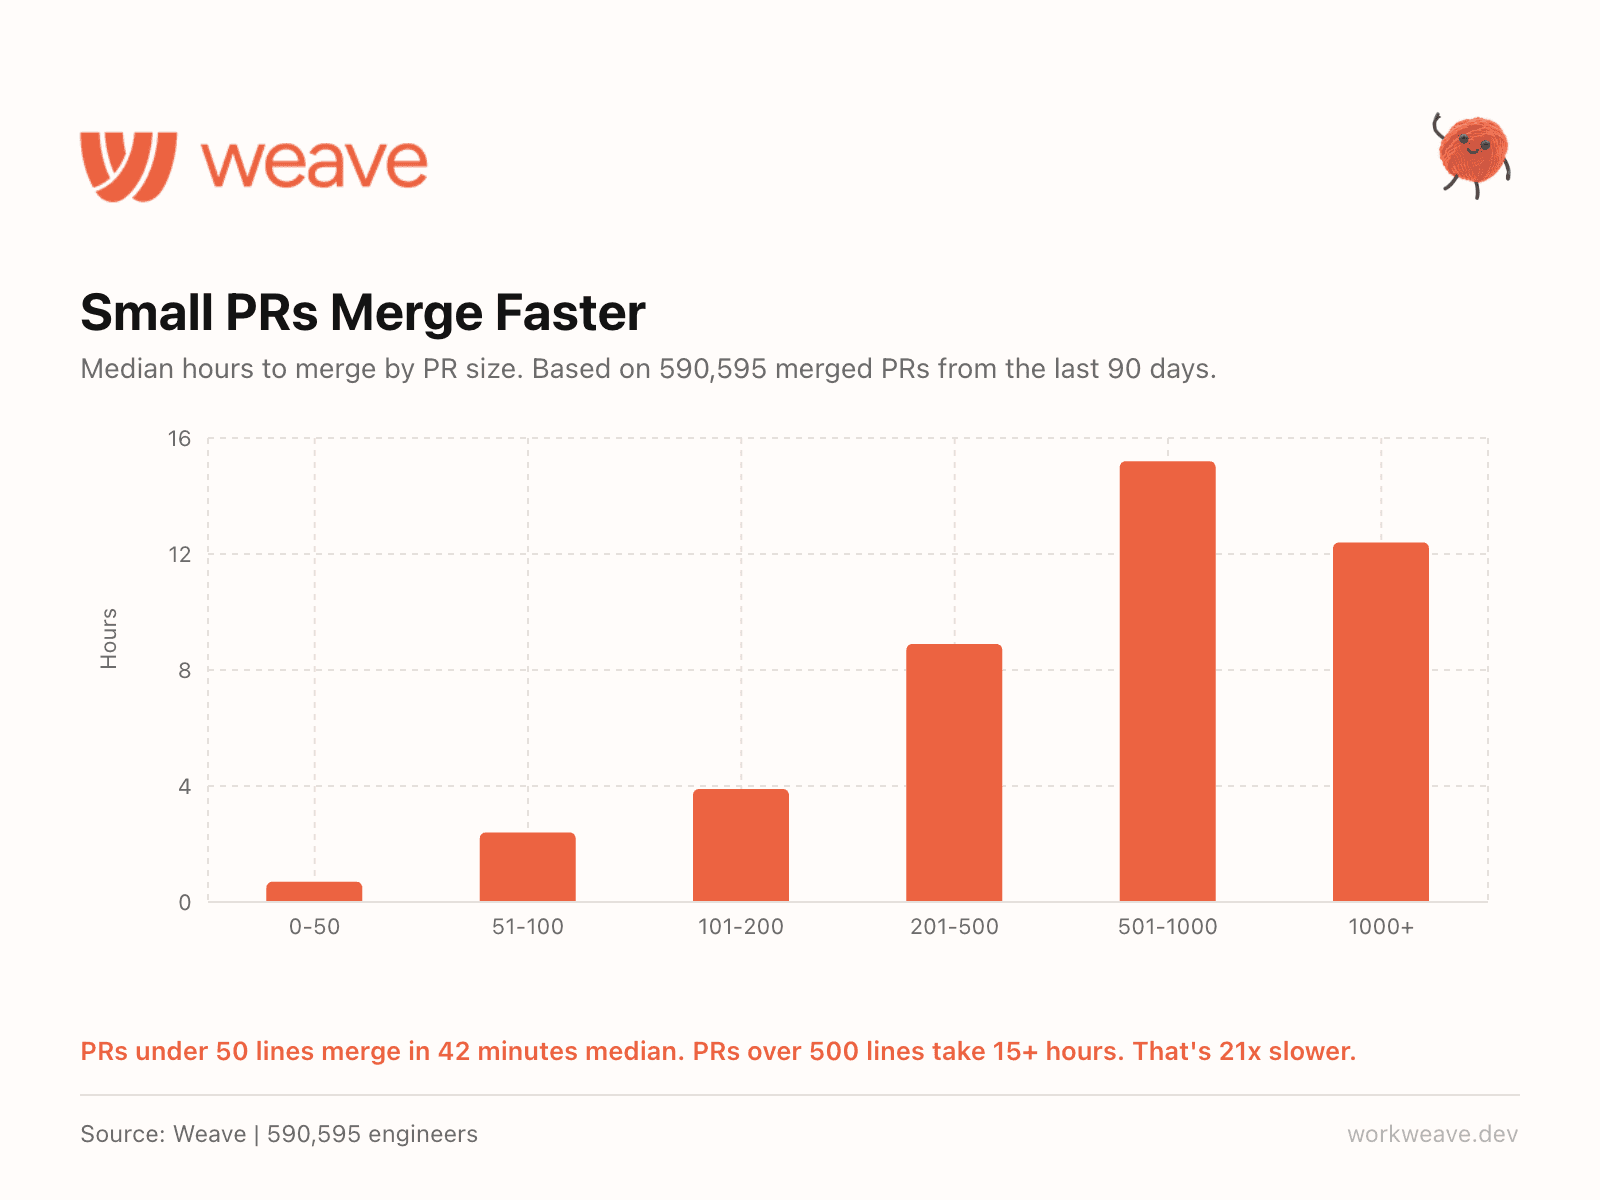
12. Small PRs merge 21x faster
Across 590,595 merged PRs: PRs under 50 lines merge in 42 minutes median. PRs over 500 lines take 15+ hours. That is 21x slower.
The relationship is not linear, it is exponential. Every 100 lines you add compounds the slowdown. The single highest-leverage engineering process change most teams can make is enforcing smaller PRs.
Section 4: Quality & Reviews
Review cycles are shrinking and teams are scaling quality alongside velocity.
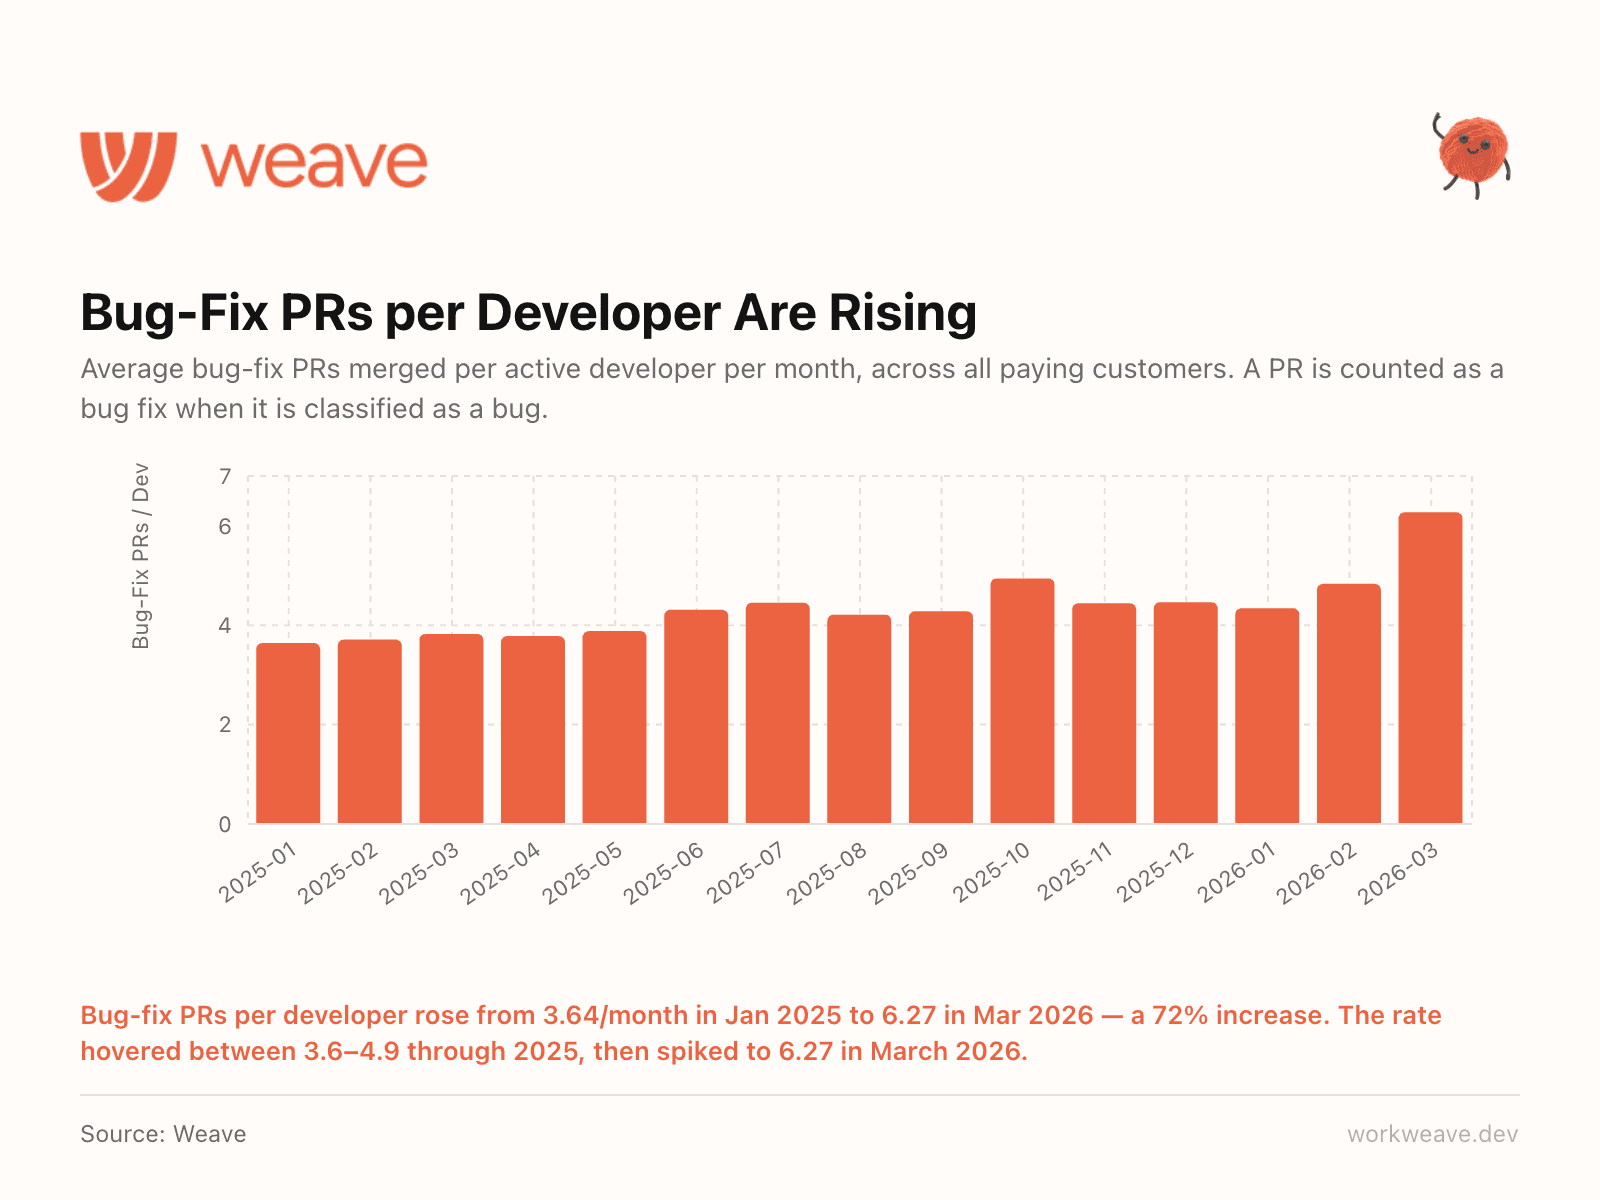
13. More code means more bugs to fix
Bug-fix PRs per developer rose from 3.64/month in January 2025 to 6.27 in March 2026, a 72% increase. Through most of 2025, this number was stable at about 3.8-4.5. Then it spiked sharply in Q1 2026, right as AI-generated code surged past 40%.
More code shipped means more bugs to fix. AI does not eliminate the debugging loop. It accelerates both sides. Teams that are not scaling their QA and review processes alongside AI adoption are building debt.
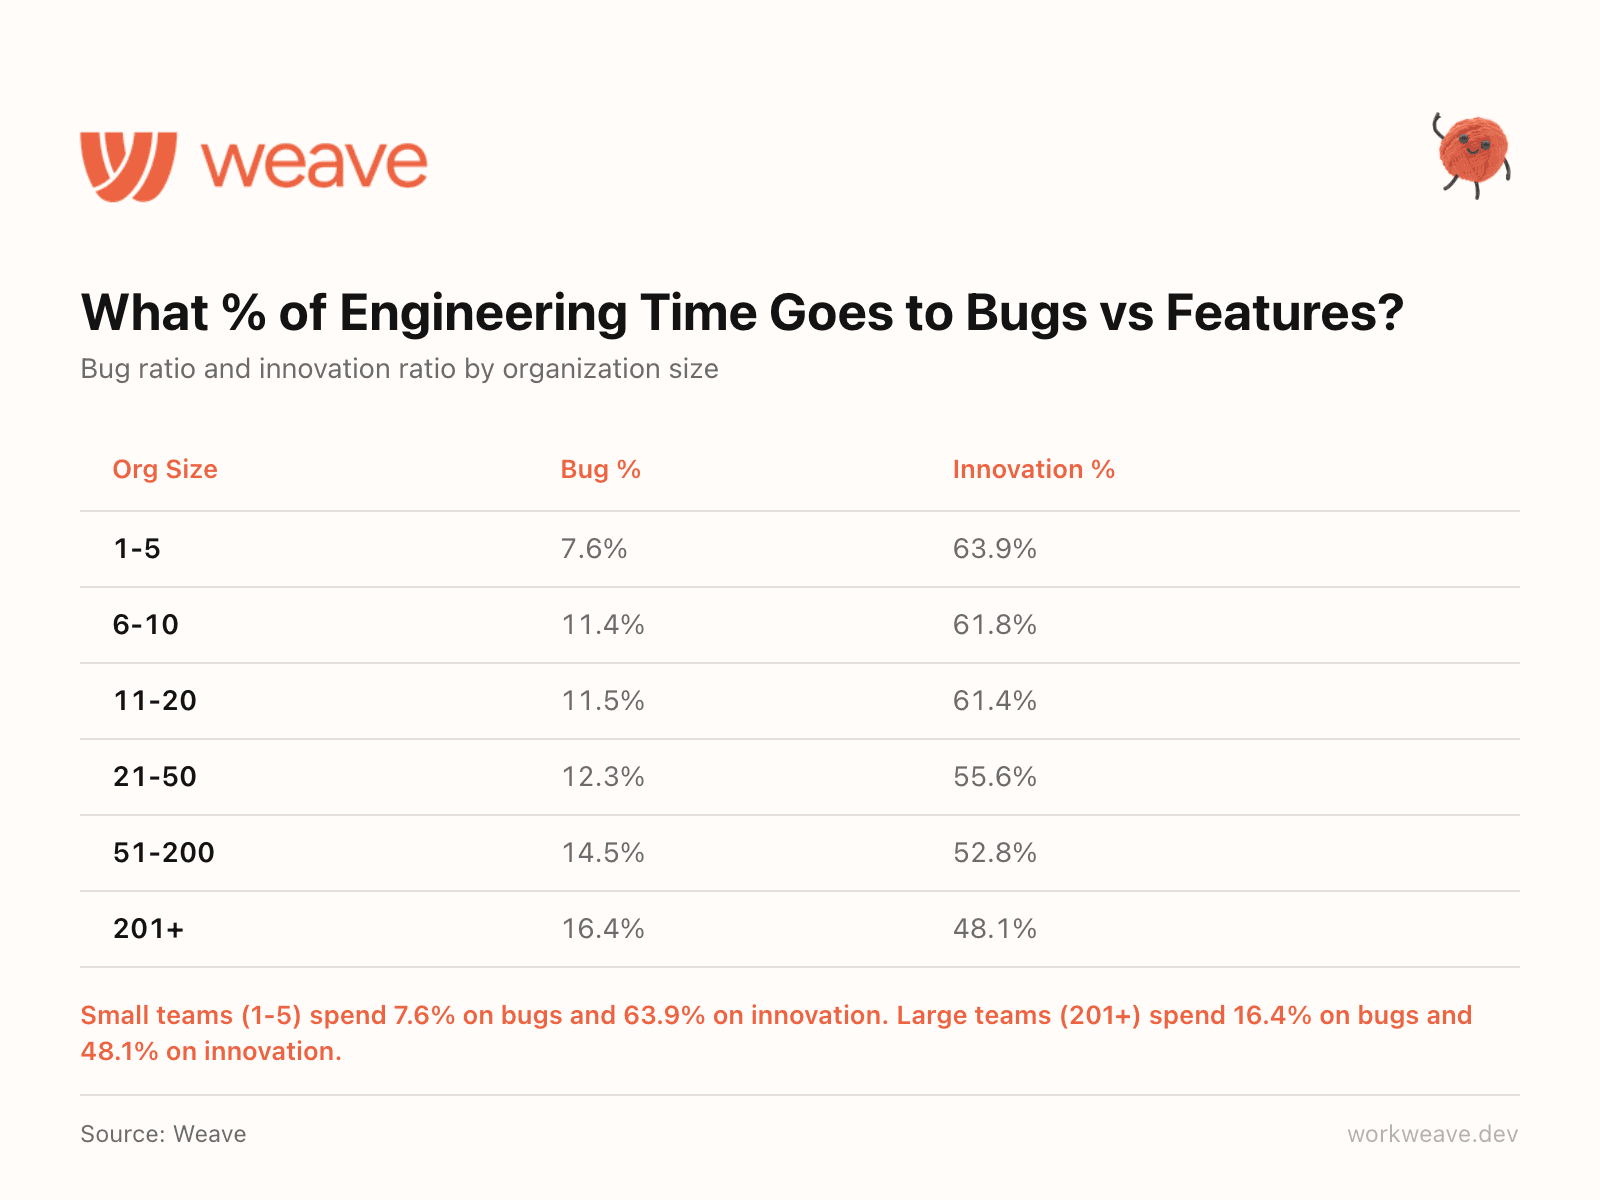
14. Smaller teams ship more features
Here is how engineering output breaks down by team size: small teams (1-5) spend 7.6% on bugs and 63.9% on innovation. Large teams (201+) spend 16.4% on bugs and 48.1% on innovation.
As teams scale, the share of output going to maintenance and bug fixes grows. The share going to new features shrinks. It is a structural reality of scaling codebases and coordination costs. Understanding the math helps you plan for it.
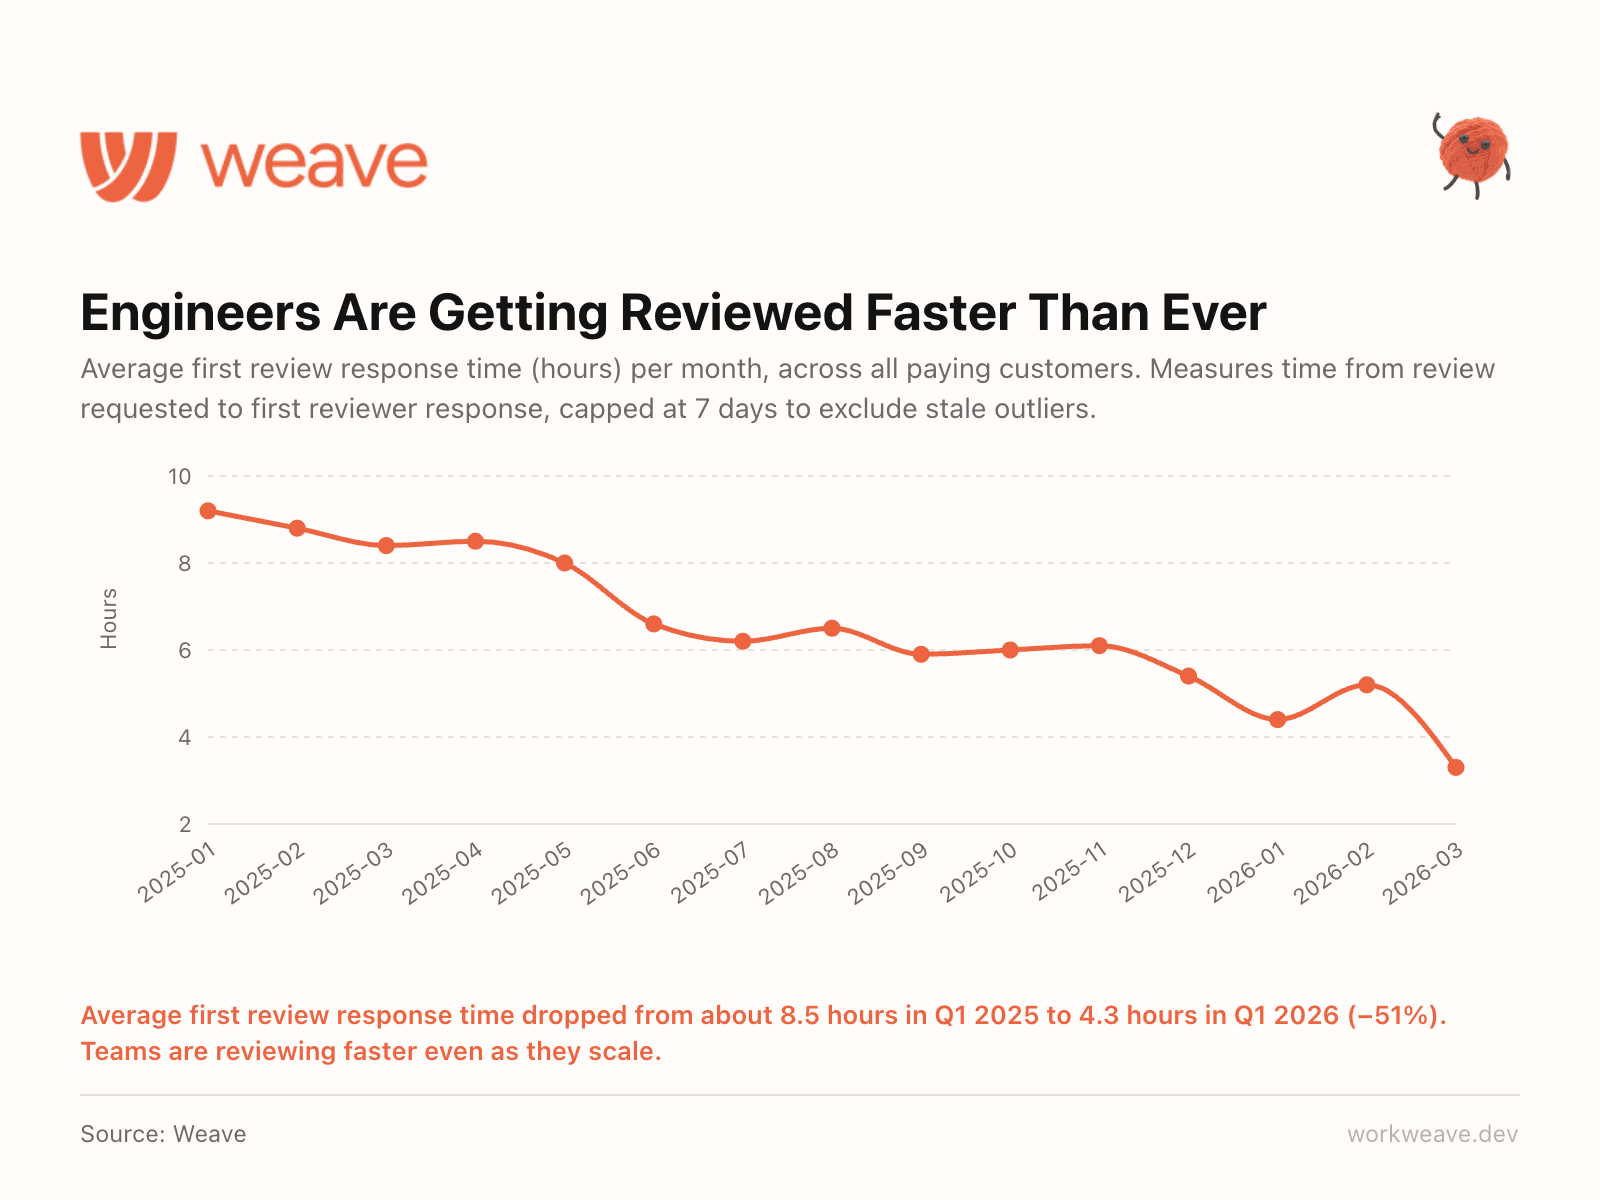
15. Reviews got faster at 5x the volume
Average first review response time dropped from 8.8 hours in Q1 2025 to 4.3 hours in Q1 2026, a 51% decrease. While review request volume grew 5.4x, from 134K to 724K.
How? AI code reviewers are now handling first-pass reviews. More teams are prioritizing this as a core workflow, not just an experiment. If reviews are still your bottleneck, this is the lever to pull.
Section 5: Unique Insights
Where engineers work and what the extreme tail of talent really looks like.
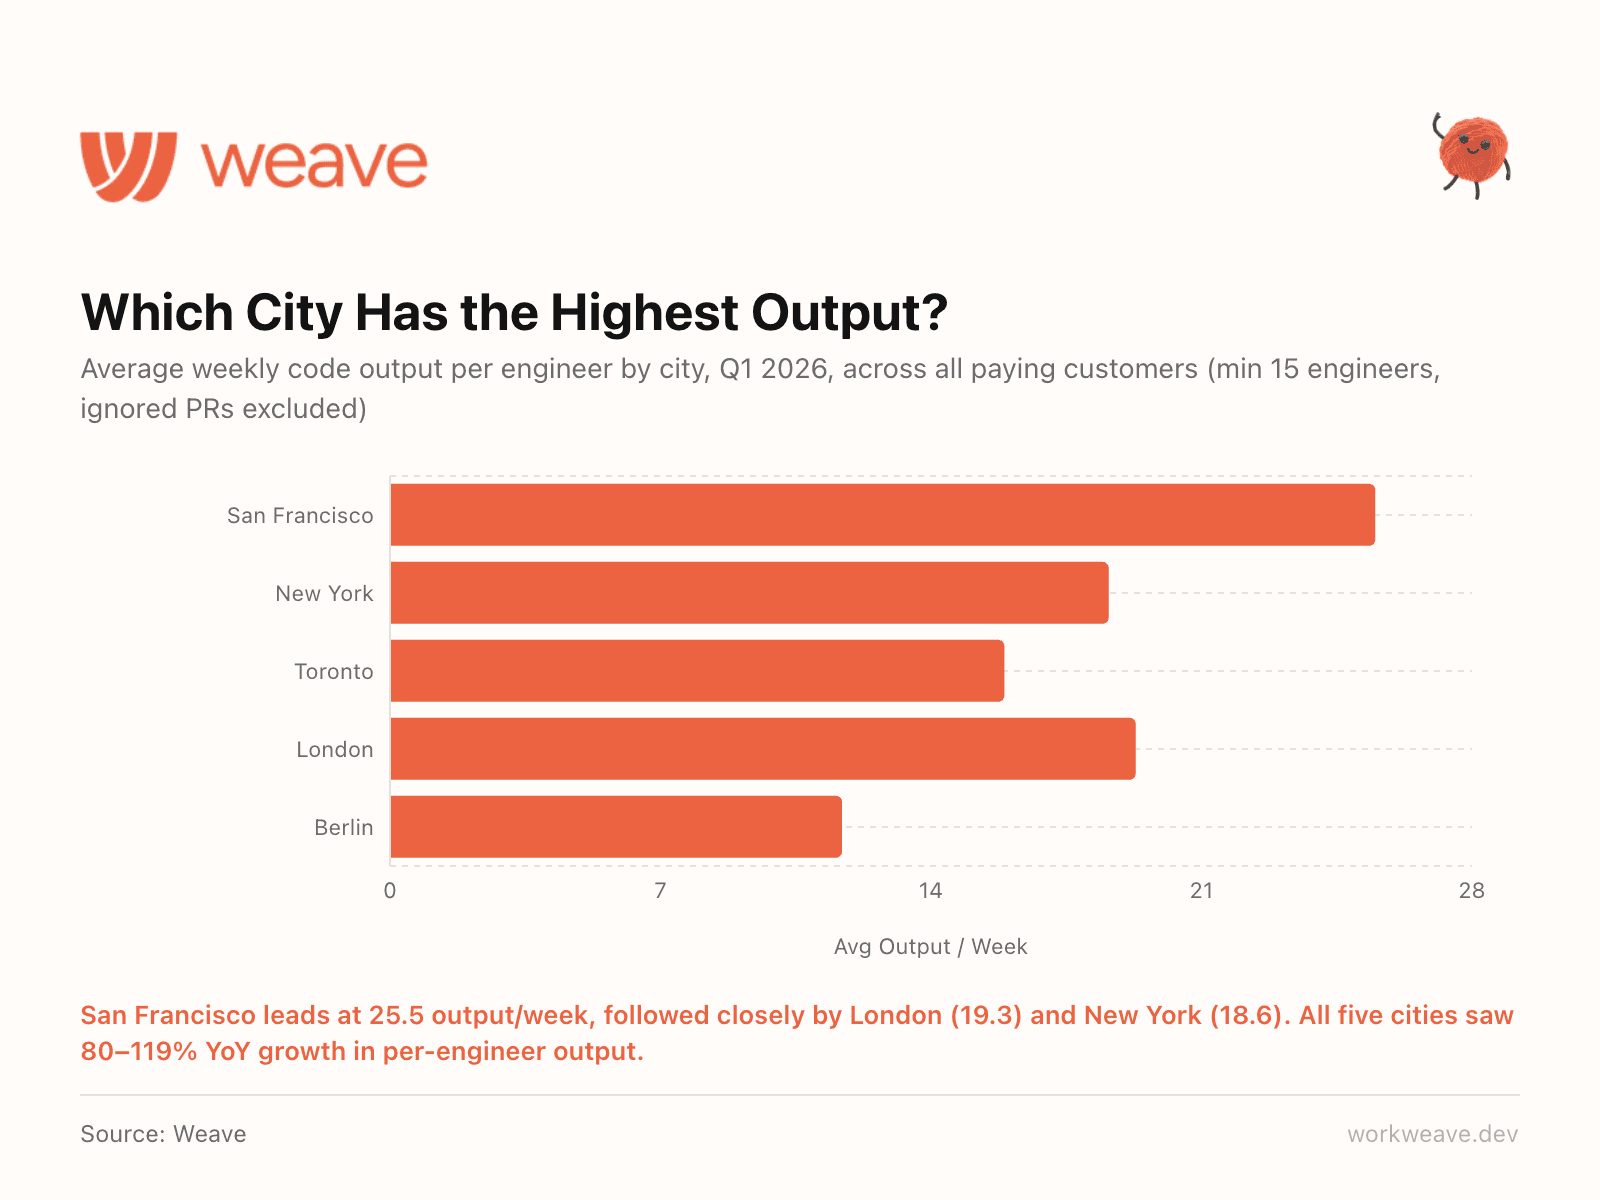
16. Geography shapes engineering output
San Francisco leads at 25.5 output/week per engineer, followed closely by London (19.3) and New York (18.6). All five top cities saw 80-119% year-over-year growth in per-engineer output.
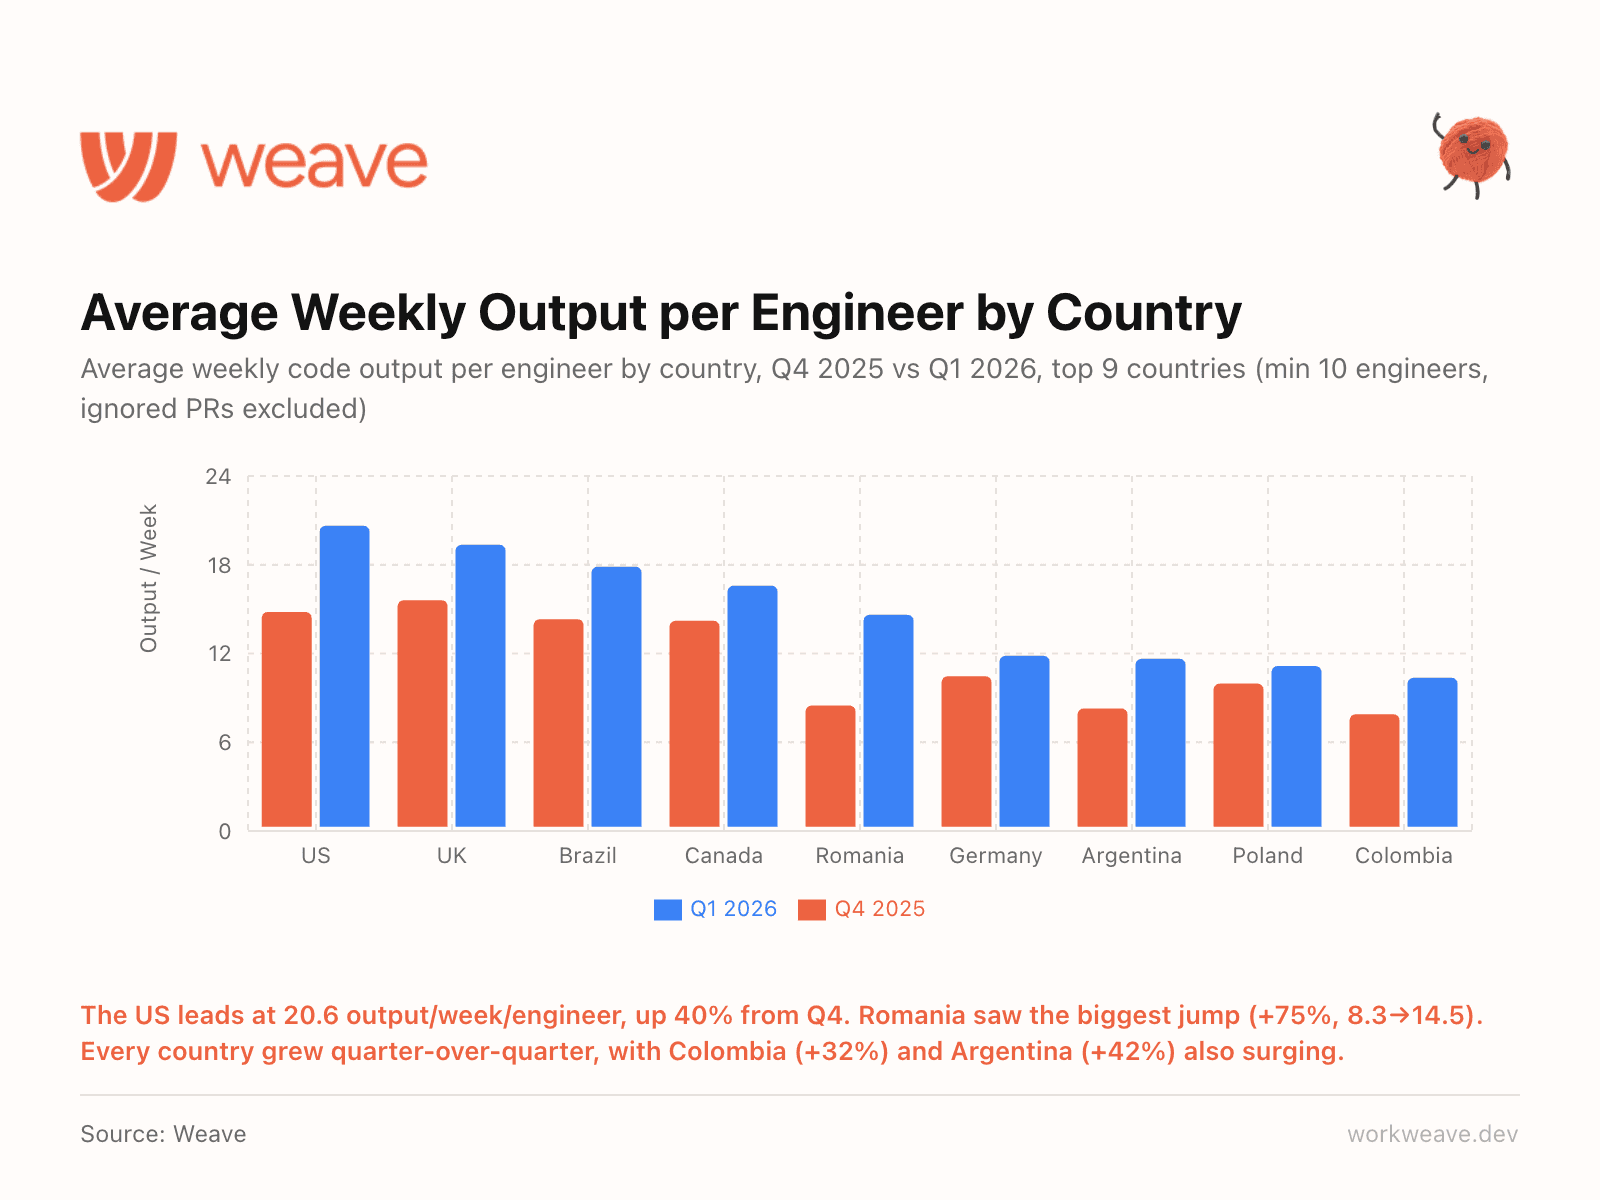
17. Every country grew quarter-over-quarter
The US leads at 20.6 output/week/engineer, up 40% from Q4. But look at the growth rates elsewhere: Romania +75% (8.3 to 14.5), Argentina +42%, Colombia +32%.
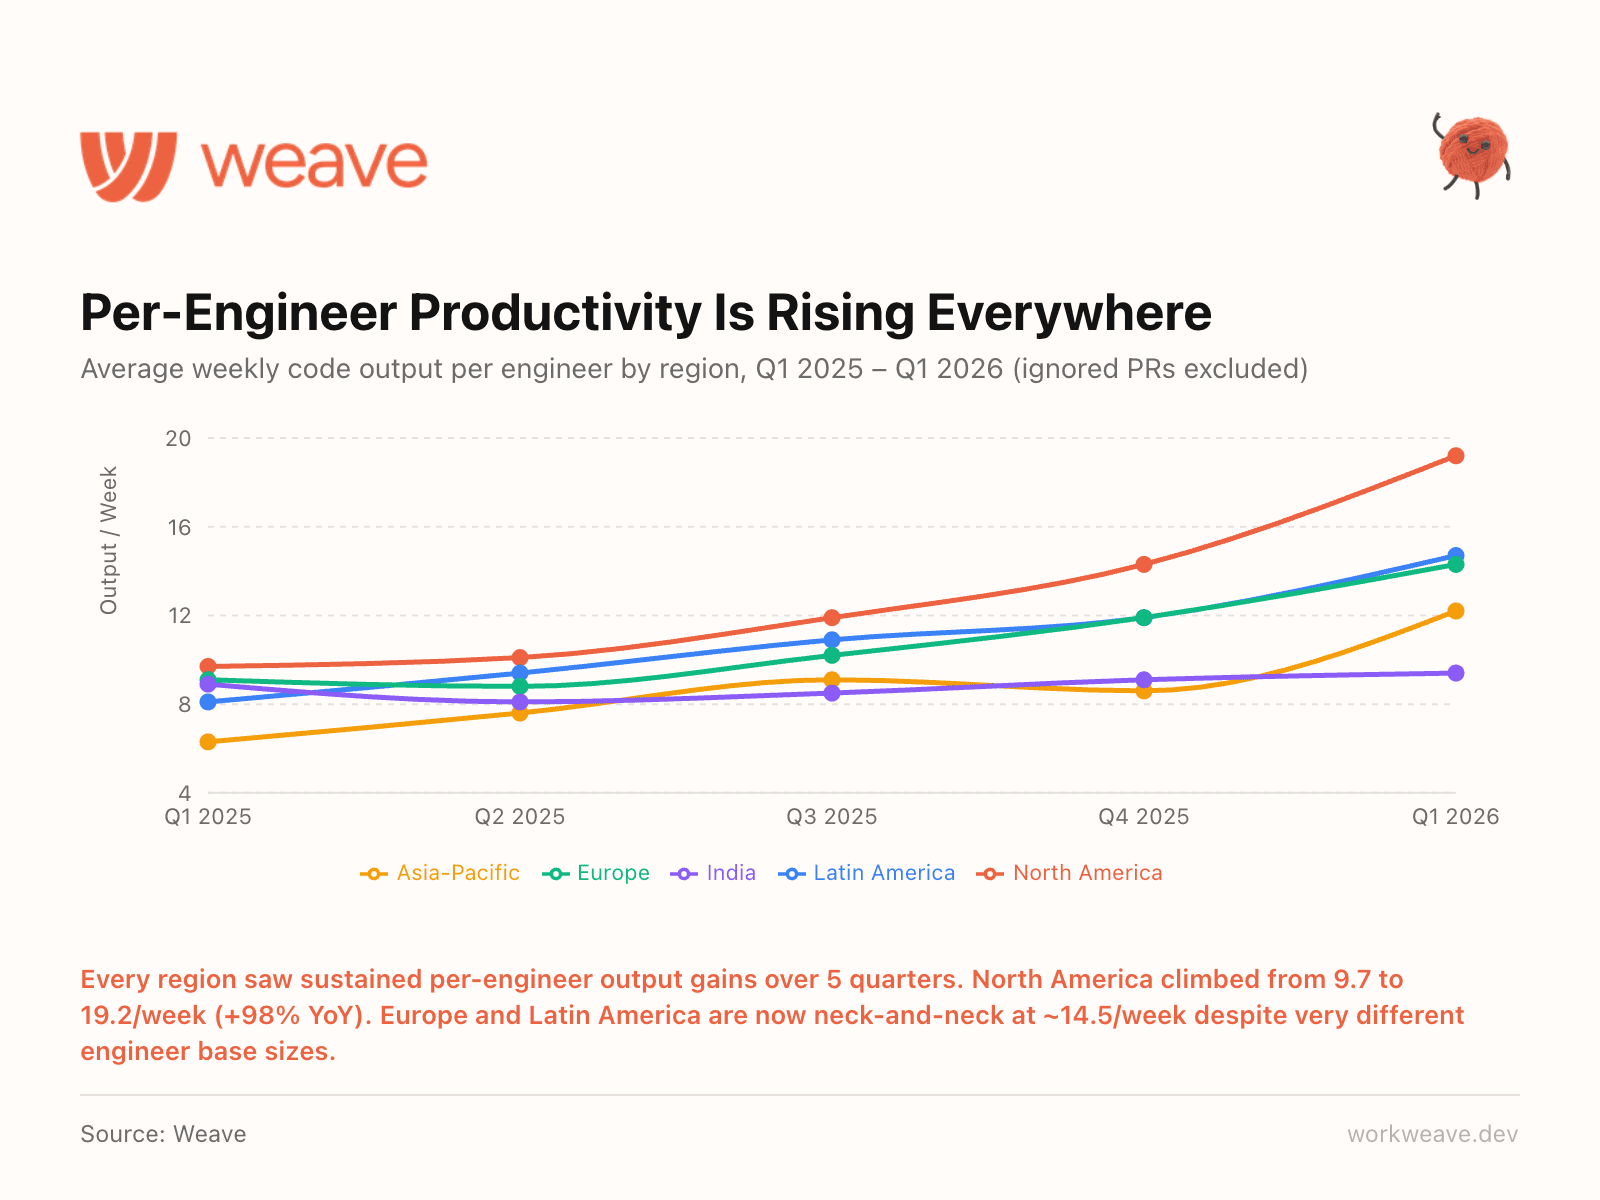
18. Every region is getting more productive
Every region saw sustained per-engineer output gains over 5 consecutive quarters. North America climbed from 9.7 to 19.2/week (+98% YoY). Europe and Latin America are now neck-and-neck at about 14.5/week despite very different engineer base sizes.
The gap between regions is narrowing. AI tooling is the great equalizer. A team in Buenos Aires with the right setup can match a team in SF without it.
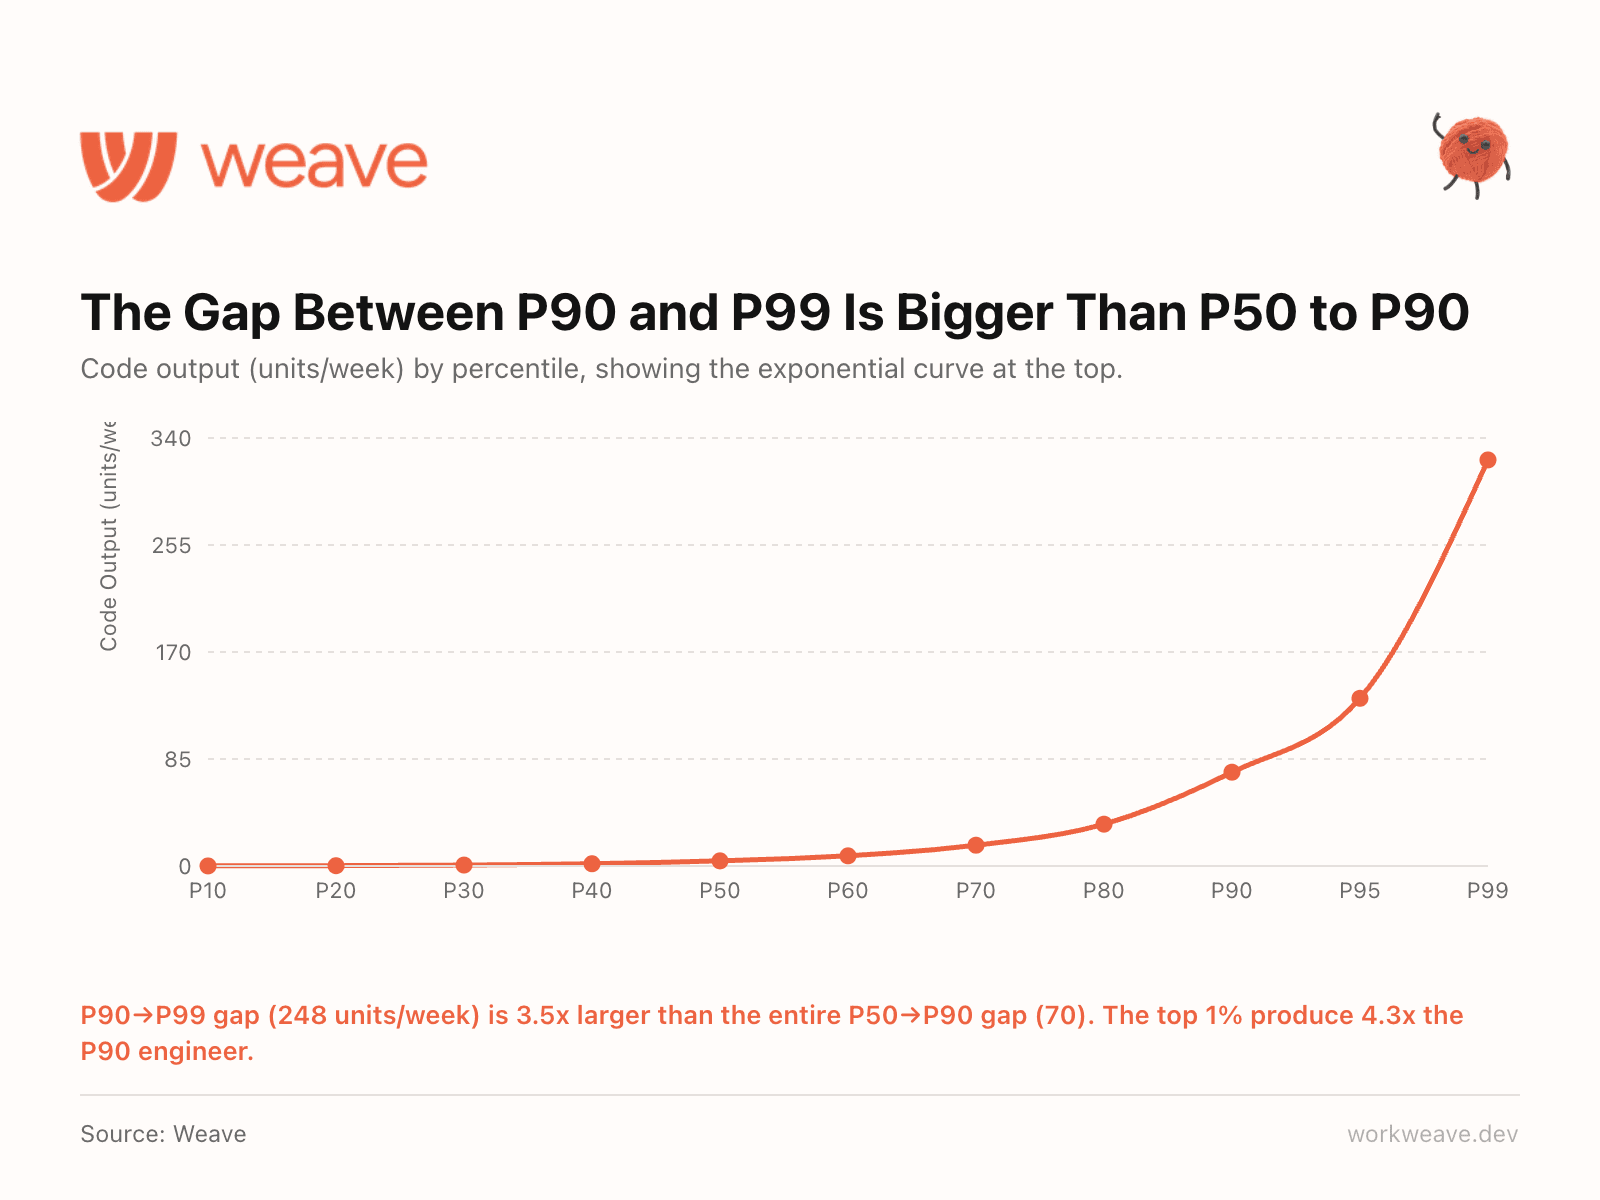
19. The top 1% produce 4.3x the output of a P90 engineer
The gap between the P90 and P99 engineer is 248 units/week. The gap between P50 and P90 is just 70. That means the distance between "very good" and "exceptional" is 3.5x larger than the entire distance between "average" and "very good."
A single P99 engineer outproduces a small team of median performers. And this gap is widening as AI amplifies already-strong engineers. The best engineers are the ones adopting AI most effectively, compounding their existing advantage.
This changes how you think about hiring, retention, and compensation. The talent distribution is not a bell curve. It is exponential at the tail, and AI is making it steeper every quarter. Losing a P99 engineer is not losing one headcount. It is losing the equivalent output of 4+ strong engineers.
How is this collected?
Weave builds ML models to measure engineering productivity and AI usage. Our model scans every PR and answers the question "how long would this PR take an expert engineer to complete?" which produces our "code output" measure. We then integrate the most granular AI usage data for each customer (via API, Git tracking, or telemetry) and determine how much output is coming from AI vs. manually writing code.
See these numbers for your own team: sign up directly or request a demo.
The engineering intelligence platform for the AI era.
Trusted by engineering teams from seed stage to Fortune 500