
By
Andrew Churchill
Published
Read Time:
The AI3: The 3 Metrics to Measure in AI Era of Software Engineering
Remember DORA metrics? Deploy frequency, lead time, change failure rate, and recovery time. Clean. Simple. Everyone knew what they meant.
Then AI broke everything.
Your deploy frequency looks great, but half your code is getting rewritten within two weeks. Lead time is down, but you're burning $5K per engineer per month on AI tools and nobody knows if it's worth it.
The old playbook doesn't work anymore. You need new metrics for a new era.
This is why AI3 exists.
What is the AI3?
Three metrics to understand the effectiveness of AI in your team:
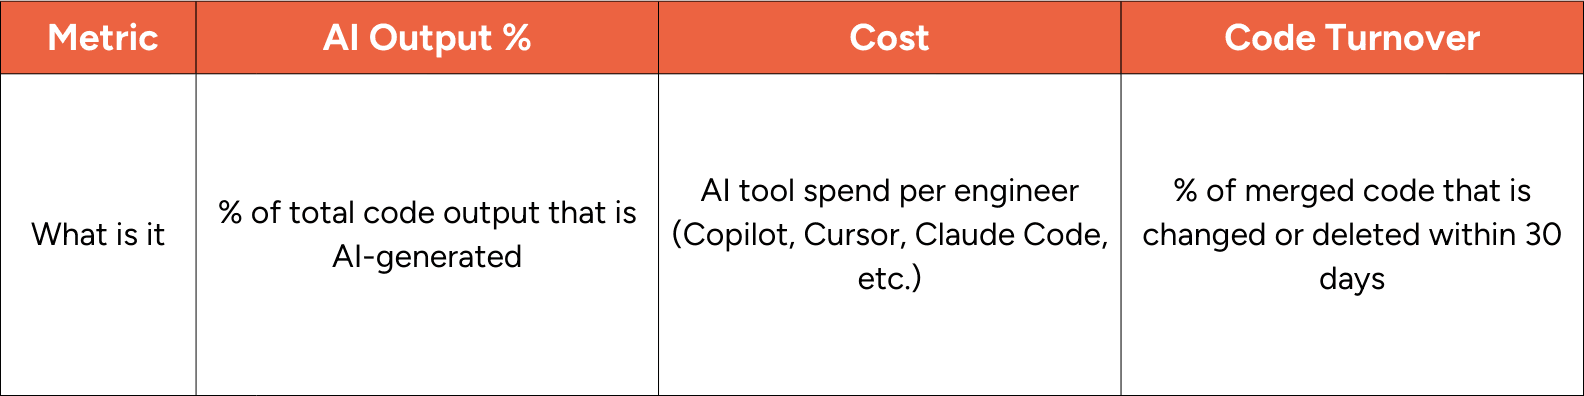
1. AI Output % – How much of your code output is AI-generated
2. Cost – What you're spending on AI tools per engineer
3. Turnover – How much code gets deleted or rewritten within 30 days
These three numbers tell you everything you need to know about whether AI is making your team more effective.
Here’s how:
1. AI Output %
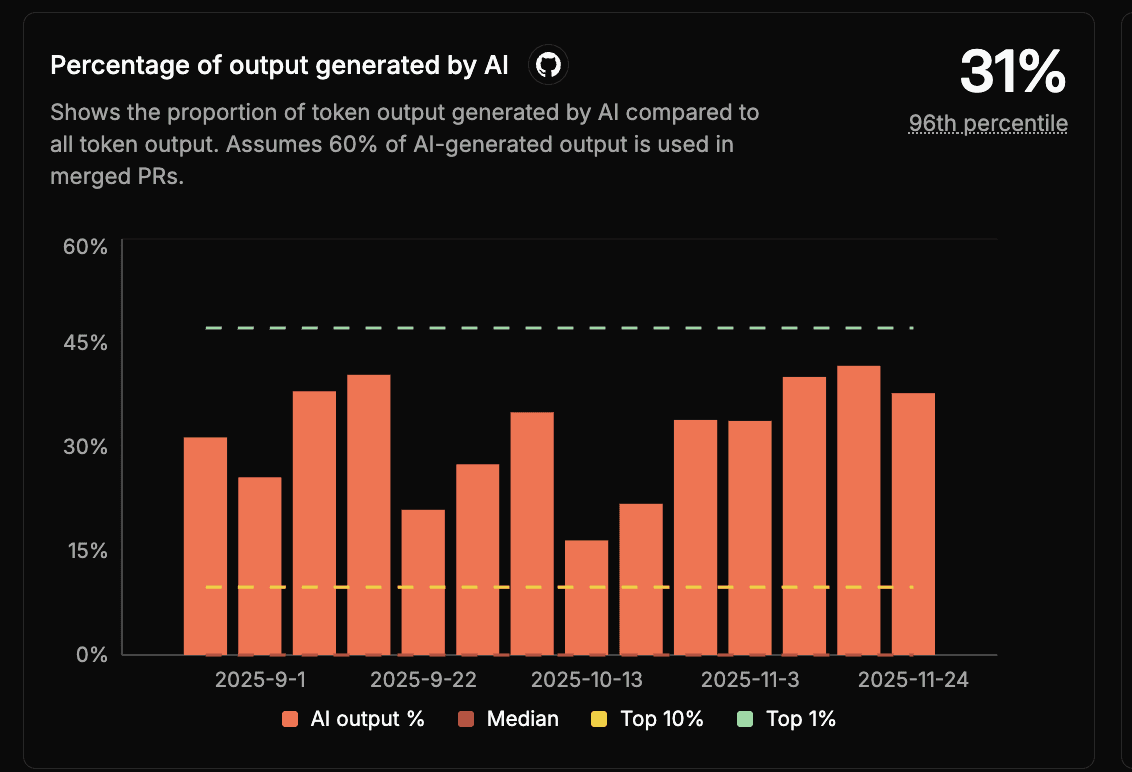
This is the foundation. If you're not measuring what percentage of your code output is from AI then, you're flying blind.
Code output is a measure of engineering work that combines ML and domain-specific LLMs to understand engineering work. Rather than Lines of Code, or # of PRs, code output asks"How long would it take an expert engineer to make this change?” and uses ML, AI and RL to answer it.
Traditional metrics like lines of code, # of PRs were bad before AI and significantly worse now. That’s why Code output exists, to provide a useful measure.
Most engineering leaders guess this number. "Probably around 30%," they say. Then they actually measure it and discover it's 12%. Or 58%. The gap between perception and reality is where decisions get made.
But here's what makes this metric powerful: it's not just the overall percentage. It's where AI is being used.
AI writes 65% of your test code but 8% of core logic? That's a pattern.
Junior engineers at 3x AI usage compared to seniors? That's another pattern.
AI code concentrated in certain repos or teams? That's information.
The goal isn't to maximize this number. The goal is to know it, understand it, and make informed decisions based on it.
2. Cost
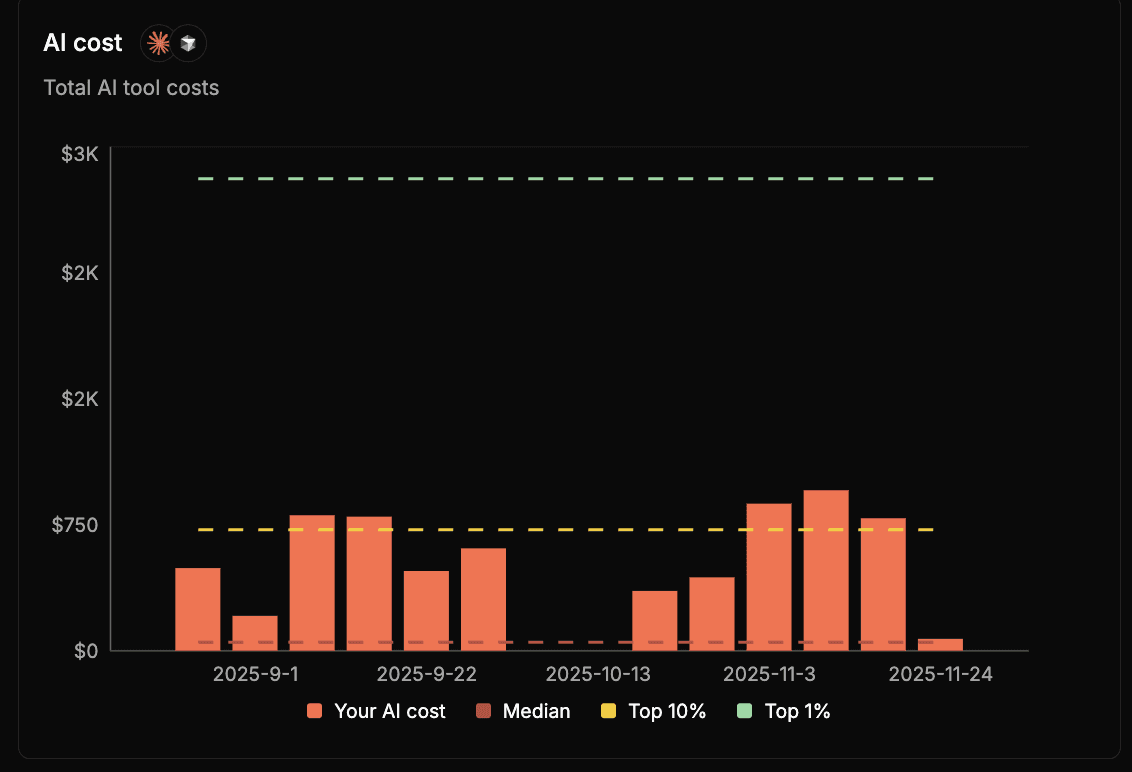
Unlike traditional SaaS where costs are predictable, AI tool costs scale with usage in ways that surprise finance teams every quarter.
Teams are spending thousands of dollars each month on AI tools for engineers. Some are aware of it, and some are not.
The real insight comes when you connect cost to output. Spending $4,000/engineer/year with 15% AI output? That's a very different story than $4,000 with 45% output. Neither is automatically good or bad, but you need to know which world you're living in.
3. Turnover
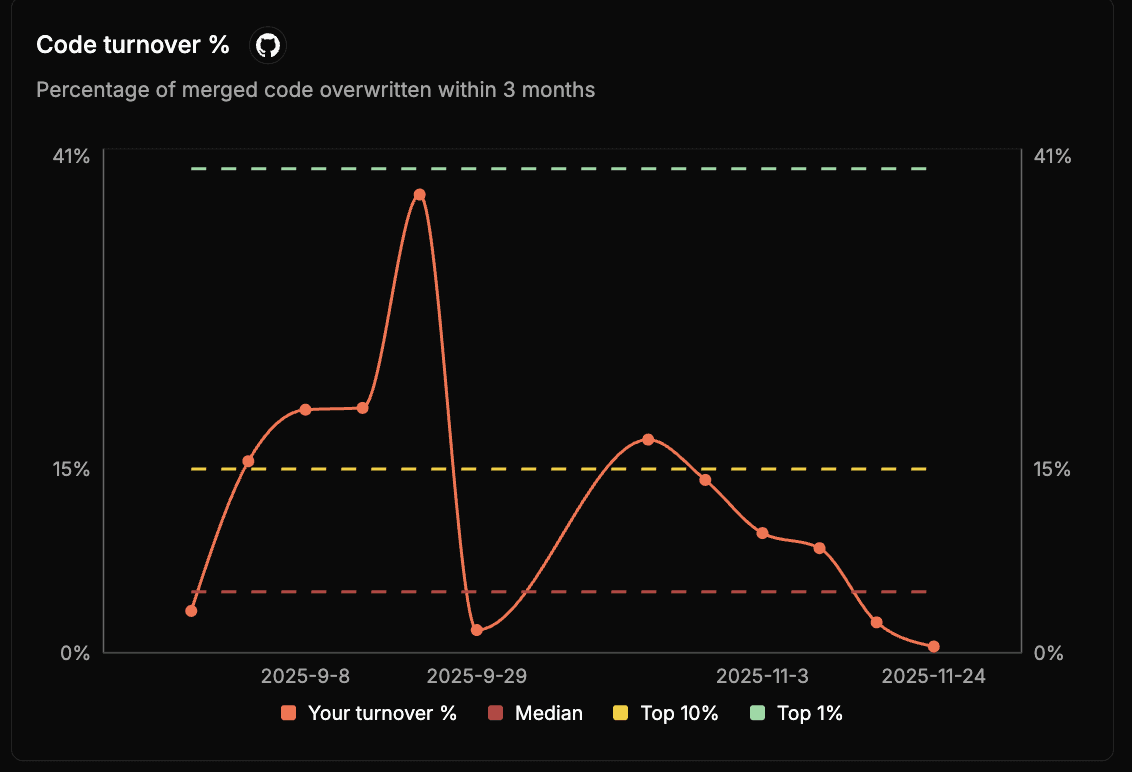
This is the metric nobody's tracking yet, and it's becoming the most important one.
Code turnover is simple: how much code gets written in the following 3 months of it being merged.
AI makes it incredibly easy to write code. That's the point. But it also makes it incredibly easy to write code that doesn't stick - code that solves the wrong problem, creates unexpected complexity, or just isn't the right approach.
High turnover isn't automatically bad. Sometimes you need to explore. But if your turnover has doubled since adopting AI and you haven't noticed, you might be mistaking activity for progress. Your velocity looks amazing, but you're running on a treadmill.
The magic happens when you segment turnover by AI vs. human-written code:
AI-generated tests with low turnover? Great, they're sticking.
AI-generated API endpoints with 3x the turnover of human-written ones? Worth investigating.
Why These Three Work
There are dozens of metrics you could track. But the AI3 give you something specific: they tell you if AI is actually making your team more effective.
AI Output % tells you if adoption is real
Cost tells you if the economics make sense
Turnover tells you if the output is quality
Together, they form a feedback loop:
High AI output + high turnover + high cost? You're paying a lot for code that doesn't stick.
High AI output + low turnover + reasonable cost? You've found a winning use case.
Low AI output + high cost? Time to revisit your tooling strategy.
The New Benchmark
Just like DORA gave us "Elite" performers to aspire to, using the AI3 in Weave gives you clear targets to the top 10% and median across all teams.
Start Measuring Today
The metrics that mattered in 2020 aren't enough for 2025. DORA metrics don't capture the AI layer, and that layer is now 30-50% of what your team does.
You don't need a complex implementation. Start simple:
Measure your AI output percentage this week
Add up your actual AI tool costs per engineer
Track turnover for the next 30 days
This is the foundation. If you're not measuring what percentage of your codebase AI is writing, you're flying blind.
" transform="translate(53 38)" width="1391.0019999999997px"/><path d="M 748.501 0 C 829.12 0 904.371 18.049 968.074 49.28 C 1020.663 75.06 1085.983 84.064 1147.583 79.071 C 1158.383 78.196 1169.353 77.747 1180.443 77.747 C 1355.393 77.747 1497.003 189.223 1497.003 326.499 C 1497.003 463.775 1355.393 575.251 1180.443 575.251 C 1169.353 575.251 1158.383 574.802 1147.583 573.927 C 1085.983 568.933 1020.663 577.937 968.074 603.72 C 904.371 634.951 829.12 652.999 748.501 652.999 C 667.88 652.999 592.629 634.951 528.925 603.72 C 476.336 577.937 411.017 568.933 349.415 573.927 C 338.483 574.811 327.52 575.253 316.553 575.251 C 141.607 575.252 0 463.776 0 326.5 C 0 189.224 141.607 77.748 316.553 77.748 C 327.65 77.748 338.614 78.197 349.416 79.072 C 411.017 84.065 476.337 75.062 528.925 49.279 C 592.629 18.05 667.88 0 748.501 0 Z" fill="transparent" height="652.999px" id="WKnkxlJxQ" stroke-dasharray="" stroke-linecap="butt" stroke-linejoin="miter" stroke-miterlimit="10" stroke-width="0.5" stroke="rgba(130, 130, 130, 0.3)" width="1497.003px"/><path d="M 644.001 0 C 713.37 0 778.118 13.963 832.927 38.124 C 878.186 58.075 934.397 65.042 987.403 61.179 C 996.703 60.501 1006.133 60.154 1015.683 60.154 C 1090.933 60.154 1159.033 81.714 1208.303 116.546 C 1257.583 151.379 1288.003 199.453 1288.003 252.5 C 1288.003 305.547 1257.583 353.621 1208.303 388.454 C 1159.033 423.286 1090.933 444.846 1015.683 444.846 C 1006.133 444.846 996.703 444.499 987.403 443.821 C 934.398 439.958 878.186 446.924 832.927 466.875 C 778.118 491.036 713.37 505 644.001 505 C 574.631 505 509.882 491.036 455.073 466.875 C 409.814 446.924 353.602 439.958 300.593 443.821 C 291.184 444.506 281.752 444.848 272.318 444.846 C 197.073 444.846 128.972 423.286 79.696 388.454 C 30.418 353.621 0 305.547 0 252.5 C 0 199.453 30.418 151.379 79.696 116.546 C 128.972 81.714 197.073 60.154 272.318 60.154 C 281.866 60.154 291.299 60.501 300.593 61.179 C 353.602 65.042 409.814 58.075 455.073 38.124 C 509.882 13.964 574.631 0 644.001 0 Z" fill="transparent" height="505px" id="dQQ4CBK9S" stroke-dasharray="" stroke-linecap="butt" stroke-linejoin="miter" stroke-miterlimit="10" stroke-width="0.5" stroke="rgba(130, 130, 130, 0.3)" transform="translate(104 74)" width="1288.0030000000004px"/><path d="M 591.5 0 C 655.218 0 714.69 11.922 765.032 32.548 C 806.607 49.582 858.241 55.53 906.932 52.231 C 915.472 51.653 924.132 51.356 932.902 51.356 C 1002.022 51.357 1064.572 69.763 1109.832 99.497 C 1155.092 129.234 1183.002 170.258 1183.002 215.5 C 1183.002 260.742 1155.092 301.766 1109.832 331.503 C 1064.572 361.237 1002.022 379.643 932.902 379.644 C 924.132 379.644 915.472 379.347 906.932 378.769 C 858.241 375.47 806.607 381.418 765.032 398.452 C 714.69 419.079 655.218 431 591.5 431 C 527.781 431 468.308 419.079 417.965 398.452 C 376.39 381.418 324.757 375.47 276.066 378.769 C 267.529 379.347 258.863 379.644 250.093 379.644 C 180.977 379.643 118.427 361.237 73.171 331.503 C 27.911 301.766 0 260.742 0 215.5 C 0 170.258 27.911 129.234 73.171 99.497 C 118.427 69.763 180.977 51.357 250.093 51.356 C 258.863 51.356 267.529 51.653 276.066 52.231 C 324.757 55.53 376.39 49.582 417.965 32.548 C 468.308 11.921 527.781 0 591.5 0 Z" fill="transparent" height="431px" id="QTNF4coLA" stroke-dasharray="" stroke-linecap="butt" stroke-linejoin="miter" stroke-miterlimit="10" stroke-width="0.5" stroke="rgba(130, 130, 130, 0.3)" transform="translate(157 111)" width="1183.0020000000002px"/><path d="M 538.5 0 C 596.513 0 650.659 10.045 696.492 27.424 C 734.348 41.778 781.36 46.789 825.693 44.01 C 833.566 43.517 841.453 43.271 849.342 43.272 C 912.272 43.272 969.212 58.782 1010.412 83.832 C 1051.622 108.887 1077.002 143.433 1077.002 181.5 C 1077.002 219.567 1051.622 254.113 1010.412 279.168 C 969.212 304.218 912.272 319.728 849.342 319.728 C 841.352 319.728 833.466 319.478 825.693 318.99 C 781.36 316.211 734.348 321.222 696.492 335.576 C 650.659 352.955 596.513 363 538.5 363 C 480.486 363 426.339 352.955 380.506 335.576 C 342.65 321.222 295.638 316.211 251.305 318.99 C 243.533 319.478 235.643 319.728 227.659 319.728 C 164.73 319.728 107.784 304.218 66.585 279.168 C 25.378 254.113 0 219.567 0 181.5 C 0 143.433 25.378 108.887 66.585 83.832 C 107.784 58.782 164.73 43.272 227.659 43.272 C 235.644 43.272 243.532 43.522 251.305 44.01 C 295.637 46.789 342.65 41.778 380.506 27.424 C 426.339 10.045 480.486 0 538.5 0 Z" fill="transparent" height="363px" id="LUddM0Cto" stroke-dasharray="" stroke-linecap="butt" stroke-linejoin="miter" stroke-miterlimit="10" stroke-width="0.5" stroke="rgba(130, 130, 130, 0.3)" transform="translate(210 145)" width="1077.002px"/><path d="M 486 0 C 538.363 0 587.236 8.058 628.603 21.999 C 662.773 33.514 705.206 37.534 745.219 35.305 C 752.327 34.91 759.445 34.712 766.564 34.713 C 823.362 34.713 874.762 47.156 911.942 67.248 C 949.142 87.351 972.002 115.04 972.002 145.5 C 972.002 175.96 949.142 203.649 911.942 223.752 C 874.762 243.844 823.362 256.287 766.564 256.287 C 759.356 256.287 752.235 256.086 745.219 255.695 C 705.206 253.466 662.773 257.486 628.603 269.001 C 587.236 282.942 538.363 291 486 291 C 433.636 291 384.762 282.942 343.395 269.001 C 309.225 257.486 266.792 253.466 226.779 255.695 C 219.763 256.086 212.642 256.287 205.435 256.287 C 148.634 256.287 97.235 243.844 60.054 223.752 C 22.854 203.649 0 175.96 0 145.5 C 0 115.04 22.854 87.351 60.054 67.248 C 97.235 47.156 148.634 34.713 205.435 34.713 C 212.642 34.713 219.763 34.914 226.779 35.305 C 266.792 37.534 309.225 33.514 343.395 21.999 C 384.763 8.058 433.636 0 486 0 Z" fill="transparent" height="291px" id="oUG2urEET" stroke-dasharray="" stroke-linecap="butt" stroke-linejoin="miter" stroke-miterlimit="10" stroke-width="0.5" stroke="rgba(130, 130, 130, 0.3)" transform="translate(262 181)" width="972.002px"/><path d="M 429.5 0 C 475.784 0 518.984 5.961 555.547 16.273 C 585.748 24.791 623.25 27.764 658.614 26.115 C 664.898 25.823 671.189 25.678 677.48 25.679 C 727.692 25.679 773.122 34.883 805.982 49.745 C 838.892 64.628 859.002 85.085 859.002 107.5 C 859.002 129.915 838.892 150.372 805.982 165.255 C 773.122 180.117 727.692 189.321 677.48 189.321 C 671.109 189.321 664.815 189.173 658.614 188.884 C 623.25 187.235 585.748 190.208 555.547 198.726 C 518.984 209.038 475.785 215 429.5 215 C 383.214 215 340.015 209.038 303.451 198.726 C 273.251 190.208 235.749 187.235 200.385 188.884 C 194.184 189.173 187.89 189.321 181.519 189.321 C 131.31 189.321 85.879 180.117 53.018 165.255 C 20.111 150.372 0 129.915 0 107.5 C 0 85.085 20.111 64.628 53.018 49.745 C 85.879 34.883 131.31 25.679 181.519 25.679 C 187.89 25.679 194.184 25.826 200.385 26.115 C 235.749 27.764 273.25 24.791 303.451 16.273 C 340.015 5.961 383.214 0 429.5 0 Z" fill="transparent" height="215px" id="kwmo_rb6T" stroke-dasharray="" stroke-linecap="butt" stroke-linejoin="miter" stroke-miterlimit="10" stroke-width="0.5" stroke="rgba(130, 130, 130, 0.3)" transform="translate(319 219)" width="859.002px"/><path d="M 369.5 0 C 409.33 0 446.505 3.975 477.969 10.851 C 503.951 16.528 536.216 18.509 566.642 17.41 C 572.052 17.215 577.465 17.118 582.878 17.119 C 626.087 17.119 665.184 23.257 693.462 33.165 C 707.602 38.12 719.012 44.008 726.872 50.522 C 734.742 57.039 739.002 64.131 739.002 71.5 C 739.002 78.869 734.742 85.961 726.872 92.478 C 719.012 98.992 707.602 104.88 693.462 109.835 C 665.184 119.743 626.087 125.881 582.878 125.881 C 577.396 125.881 571.979 125.783 566.642 125.59 C 536.216 124.491 503.951 126.472 477.969 132.149 C 446.505 139.025 409.33 143 369.5 143 C 329.669 143 292.494 139.025 261.029 132.149 C 235.047 126.472 202.782 124.491 172.356 125.59 C 166.947 125.785 161.534 125.882 156.121 125.881 C 112.912 125.881 73.815 119.743 45.539 109.835 C 31.398 104.88 19.989 98.992 12.126 92.478 C 4.26 85.961 0 78.869 0 71.5 C 0 64.131 4.26 57.039 12.126 50.522 C 19.989 44.008 31.398 38.12 45.539 33.165 C 73.815 23.257 112.912 17.119 156.121 17.119 C 161.603 17.119 167.019 17.217 172.356 17.41 C 202.781 18.509 235.047 16.528 261.029 10.851 C 292.494 3.975 329.669 0 369.5 0 Z" fill="transparent" height="143px" id="ZDUWPKa3g" stroke-dasharray="" stroke-linecap="butt" stroke-linejoin="miter" stroke-miterlimit="10" stroke-width="0.5" stroke="rgba(130, 130, 130, 0.3)" transform="translate(379 255)" width="739.0020000000002px"/><path d="M 306.5 0 C 339.554 0 370.405 2.153 396.518 5.878 C 418.068 8.952 444.831 10.026 470.071 9.431 C 474.5 9.326 478.996 9.272 483.546 9.272 C 519.406 9.272 551.855 12.598 575.326 17.967 C 587.065 20.652 596.531 23.843 603.049 27.368 C 606.312 29.131 608.812 30.965 610.482 32.842 C 612.162 34.715 613.002 36.606 613.002 38.5 C 613.002 40.394 612.162 42.285 610.482 44.158 C 608.812 46.035 606.312 47.869 603.049 49.632 C 596.531 53.157 587.065 56.348 575.326 59.033 C 551.855 64.402 519.406 67.728 483.546 67.728 C 478.996 67.728 474.501 67.674 470.072 67.569 C 444.832 66.974 418.068 68.047 396.518 71.121 C 370.405 74.846 339.554 77 306.5 77 C 273.445 77 242.594 74.846 216.481 71.121 C 194.931 68.047 168.167 66.974 142.927 67.569 C 138.498 67.674 134.003 67.728 129.453 67.728 C 93.593 67.728 61.144 64.402 37.673 59.033 C 25.934 56.348 16.468 53.157 9.95 49.632 C 6.69 47.869 4.191 46.035 2.512 44.158 C 0.836 42.285 0 40.394 0 38.5 C 0 36.606 0.836 34.715 2.512 32.842 C 4.191 30.965 6.69 29.131 9.95 27.368 C 16.468 23.843 25.934 20.652 37.673 17.967 C 61.144 12.598 93.593 9.272 129.453 9.272 C 134.003 9.272 138.498 9.326 142.927 9.431 C 168.167 10.026 194.93 8.952 216.48 5.878 C 242.593 2.153 273.445 0 306.5 0 Z" fill="transparent" height="77.00000000000006px" id="KDODgiTvq" stroke-dasharray="" stroke-linecap="butt" stroke-linejoin="miter" stroke-miterlimit="10" stroke-width="0.5" stroke="rgba(130, 130, 130, 0.3)" transform="translate(442 288)" width="613.002px"/><path d="M 242.5 0 C 268.67 0 293.098 0.774 313.776 2.111 C 330.821 3.214 351.996 3.599 371.967 3.386 C 375.524 3.348 379.08 3.329 382.637 3.329 C 411.03 3.329 436.727 4.522 455.32 6.451 C 464.619 7.416 472.125 8.563 477.297 9.832 C 479.887 10.467 481.865 11.126 483.184 11.795 C 483.844 12.13 484.313 12.455 484.611 12.759 C 484.907 13.061 485 13.307 485 13.5 C 485 13.693 484.907 13.939 484.611 14.241 C 484.313 14.545 483.844 14.87 483.184 15.205 C 481.865 15.874 479.887 16.533 477.297 17.168 C 472.125 18.437 464.619 19.584 455.32 20.549 C 436.727 22.478 411.03 23.671 382.637 23.671 C 379.034 23.671 375.474 23.652 371.967 23.614 C 351.996 23.401 330.821 23.786 313.776 24.889 C 293.098 26.226 268.67 27 242.5 27 C 216.329 27 191.901 26.226 171.223 24.889 C 154.177 23.786 133.003 23.401 113.031 23.614 C 109.524 23.652 105.964 23.671 102.362 23.671 C 73.969 23.671 48.272 22.478 29.679 20.549 C 20.38 19.584 12.874 18.437 7.702 17.168 C 5.112 16.533 3.134 15.874 1.815 15.205 C 1.155 14.87 0.686 14.545 0.388 14.241 C 0.092 13.939 0 13.693 0 13.5 C 0 13.307 0.092 13.061 0.388 12.759 C 0.686 12.455 1.155 12.13 1.815 11.795 C 3.134 11.126 5.112 10.467 7.702 9.832 C 12.874 8.563 20.38 7.416 29.679 6.451 C 48.272 4.522 73.969 3.329 102.362 3.329 C 105.964 3.329 109.524 3.348 113.031 3.386 C 133.003 3.599 154.177 3.214 171.223 2.111 C 191.901 0.774 216.329 0 242.5 0 Z" fill="transparent" height="26.999999999999886px" id="g_28k_kKg" stroke-dasharray="" stroke-linecap="butt" stroke-linejoin="miter" stroke-miterlimit="10" stroke-width="0.5" stroke="rgba(130, 130, 130, 0.3)" transform="translate(506 313)" width="485px"/></g></svg>)

By
Andrew Churchill
Published
The engineering intelligence platform for the AI era.
Trusted by engineering teams from seed stage to Fortune 500